

The labor market has confounded investors in the past few quarters. There needs to be alternative measures of the labor market because the unemployment rate isn’t cutting it, says Don Kaufman, co-founder of TheoTrade.
As I showed in a previous article, the San Francisco Fed President thought the labor market was nearly full in 2015. The 2008 financial crisis caused millions of people to be unemployed for longer than normal. Some people needed to learn skills for a new career.
Just like how there are still 2.5 million houses underwater, there are still workers who haven’t found a new career. Those who say the workers who haven’t been employed for years don’t have skills have been proven wrong. There is now more on-the-job training.
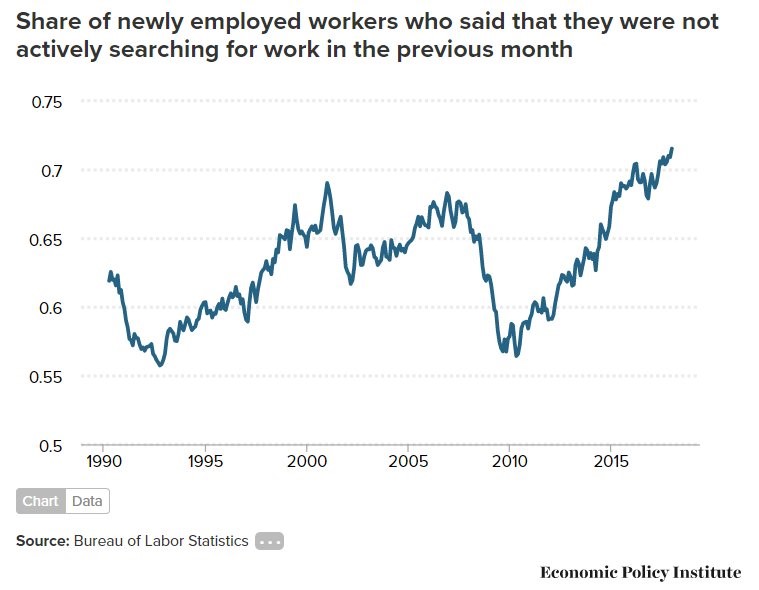
As you can see from the chart, the percentage of workers who found a job and weren’t searching for a job in the past month has increased to the highest point in the past 28 years.
There are many employers who would rather go with a worker who has been out of the labor market for a few years than hire a qualified worker at higher pay. The critical threshold is when there aren’t enough workers on the sidelines to fill the needs of employers. Then workers will start getting higher wages and the beginning of the end of the labor market cycle will be upon us.
For the rest of the year, I still think the labor market will confound analysts and investors. Traders completely missed this when the market overreacted to the wage growth print from the January BLS report. To be clear, it’s fair to worry about the Fed being too hawkish, but I think it’s too early to worry about accelerated inflation.
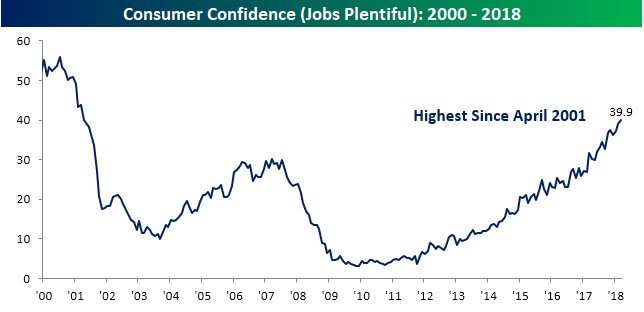
As you can see from the chart below, the index which measures whether consumers think jobs are plentiful has reached the highest point since April 2001. This strength is making up for the period between 2009 and 2012 when almost no one thought it was easy to get a job.
Just like the employment to population rate for prime aged workers, the indicator is below the peak in 2000. As you can see, this index is about 14 points below that peak. The economy in 2007 wasn’t near the full completion of the business cycle, but there was a recession because of the exogenous shock to the system that was the mortgage crisis and the subsequent problems with the derivatives market.
Speaking of derivatives, Deutsche Bank (DB) is in the news again as worries about its derivatives portfolio grow. Don’t be afraid of the notional value of the bank’s portfolio because that doesn’t mean it has too much risk.
However, it is disconcerting to see the stock of the biggest bank in Germany down 31.54% since December. The stock is now only up 24.98% from the low it made in 2016 when it was one of the most discussed risks facing the market.
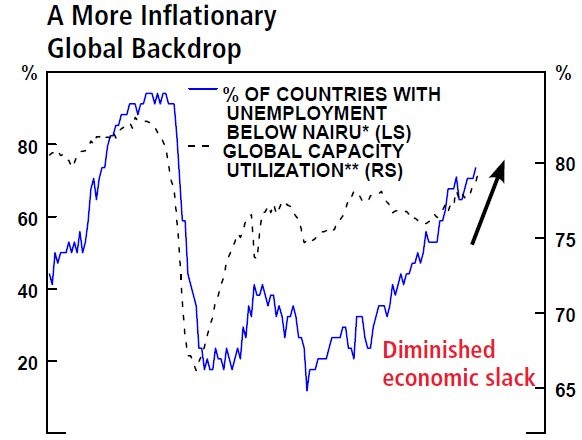
As you can see from the chart below, the blue line shows the percentage of countries with an unemployment rate below NAIRU. That acronym stands for the non-accelerating inflation rate of unemployment.
The theory is that inflation increases when the unemployment rate gets below that number. The fact that 75% of countries in the OECD have unemployment rates below the NAIRU should mean inflation is coming, but it’s important to realize that the NAIRU is an estimate and the unemployment rate isn’t a perfect measurement of the slack in the labor market.
The dotted line shows the capacity to utilization rate. Just like the unemployment rate, it signals the economy is near the completion of this expansion.
This is why the consensus expects a recession in the next two years.
Final Q4 GDP estimate revised much higher
Although Q4 is far in the rearview mirror, the Q4 GDP report was revised for the final time on Wednesday.
It was a major change as the quarter over quarter seasonally adjusted growth was 2.9% which was up from prior report of 2.5% growth and the consensus for 2.7% growth. The real consumer spending growth was revised higher from 3.8% growth to 4% growth. I think this report justifies my claim that Q4 was boosted by hurricane rebuilding and Q1 growth will see a slight deceleration. The non-durable spending growth was revised up five-tenths from 4.3% to 4.8%. Durable spending was down one-tenth to 13.7% growth.
This was very strong because of the hurricane related spending on automobiles which pulled forward demand from Q1 2018. New cars being bought in Q4 because they were destroyed means less people in the south will need to buy a new car in the next few quarters. The trend was already down in 2017 prior to the hurricanes, so this will further pressure auto sales in 2018.
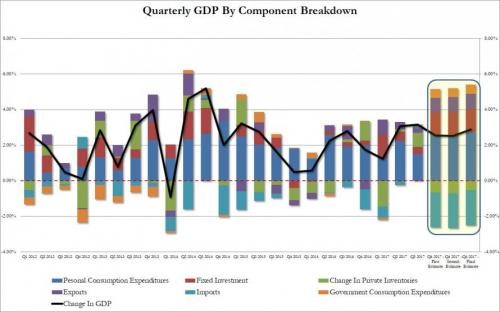
The chart below shows the breakdown in GDP growth for the first quarter release, the first update, and the final revision.
The GDP growth was pushed lower by inventory adjustments and trade. Without them, GDP growth would have been 4.5%, moving up two-tenths after this revision. Specifically, personal consumption growth caused GDP to increase 2.75%.
Fixed investment growth added 1.31% to GDP growth. Private inventories subtracted 0.53% from GDP growth. Net trade hurt GDP growth by 1.16%. Government spending added 0.51% to GDP growth.
Conclusion
The labor market shows it isn’t full by the low wage growth and the high job creation. The labor market isn’t following what the unemployment rate suggests because there are still workers coming off the sidelines. They are coming off the sidelines at the highest pace in 28 years.
The Q4 GDP growth was 2.9% because of the strong consumer spending growth which was 4%. With the negative affect of auto sales coming back down to earth in Q1, it looks like the quarter will have lower growth.
There’s still data outstanding for March which prevents a full estimate from being formed. This large revision in Q4 shows the preliminary estimate for Q1 will be far from exact.


