

Among higher-risk asset classes, these are cheaper this week: Dow, Eurozone Financials, US Banks, Hi-Beta, EuroStoxx 50, Emerging Markets, Eurozone Far-East & Australasia, Transports, writes Ziad Jasani.

View my Market Strategy Session
Recorded: 2:03 pm, July 13, 2018
Duration: 2:02
Global Risk Sentiment this week
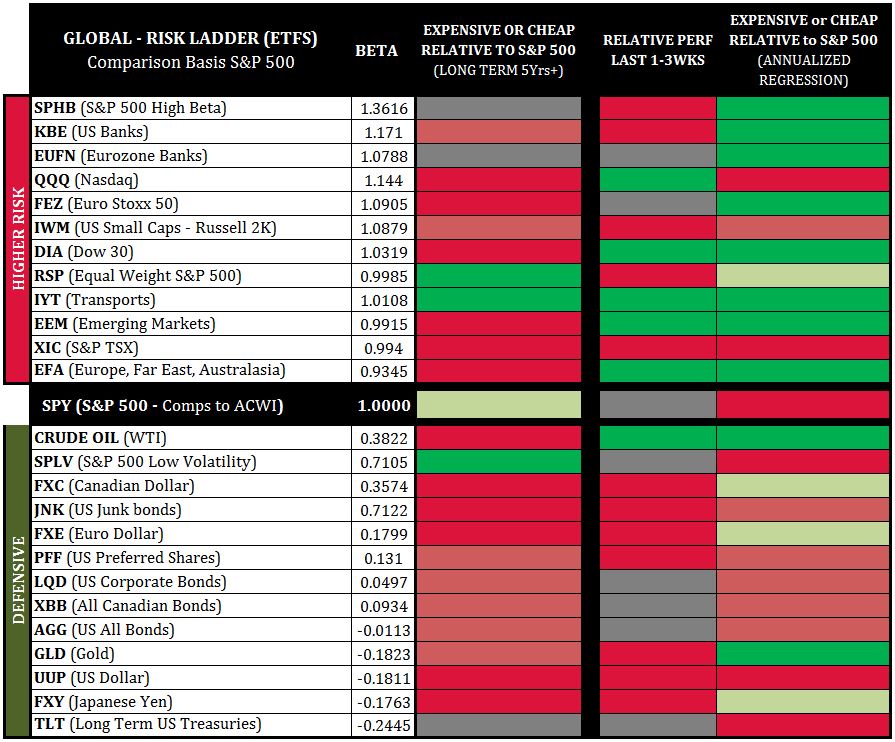
Looking at the third column to the right we see a comparison of higher risk asset classes and defensive asset classes back to the S&P 500 (SPY) on an annual basis.
Comparison to the S&P 500 creates a “risk-ladder” where market risk is considered neutral.
When we see more green above the SPY-line (middle line) and more red below we have a general risk-on signal; and vice-versa - red above, green below would be risk-off.
Currently, higher-risk asset classes are polarized. Some very expensive and most very cheap, indicative of the current geopolitical and tariff-trade war issues.
Cheap: Dow, Eurozone Financials, US Banks, Hi-Beta, EuroStoxx 50, Emerging Markets, Eurozone Far-East & Australasia, Transports.
Expensive: Nasdaq, Russell 2K, TSX, S&P 500. Defensive asset classes present as very expensive.
For equities to advance, the USD must soften up. Overall, our Global Risk Ladder signals risk-on into the week ahead.
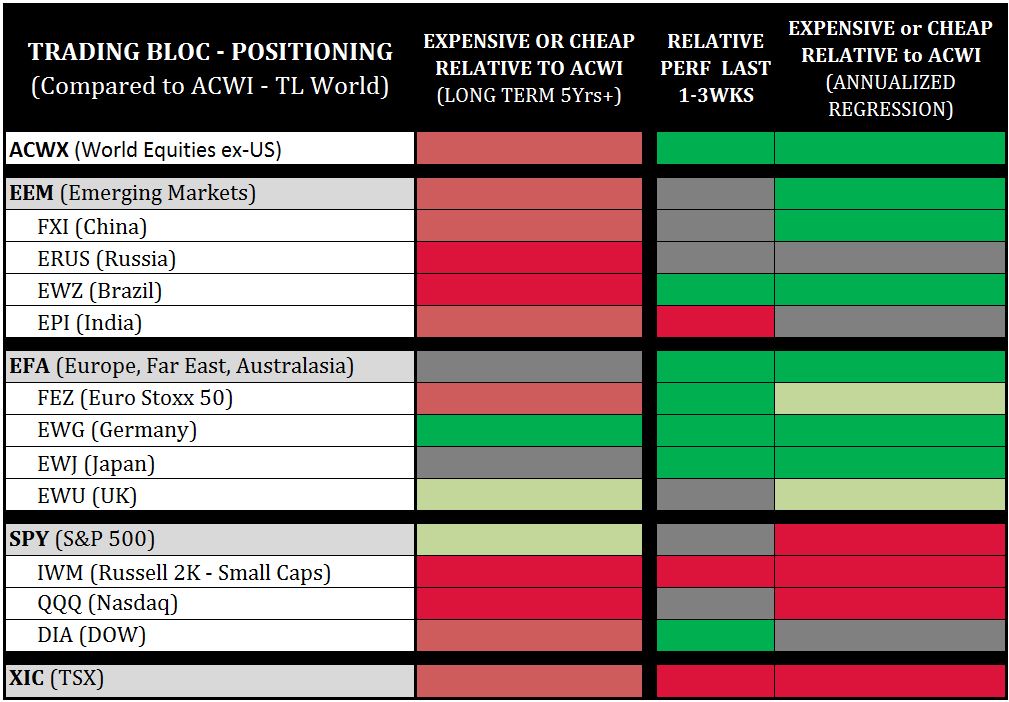
Trading Bloc Positioning this week
This chart compares major trading blocs back to the entire global equity market (ACWI), to determine which spaces are relatively cheaper or more expensive.
Why? Capital flows usually tilt towards relatively cheaper spaces, especially if the June 28 macro market-swing low continues (i.e. S&P 500 > 2,805).
U.S. markets (ex the Dow DIA) present as the most relatively expensive while Emerging Markets (EEM), and the Eurozone Far East & Australasia (EFA) present as cheap (on annual routines).
The TSX presents as 2 standard deviations expensive, which implies the TSX is likely to under-pace the world on the way up and/or move faster down. Since the late January 2018 correction we are in full swing trading mode with our short-to-mid-term capital and we remain Hold with our longer-term holdings, while the S&P 500 remains above its 200-day average.
View the Independent Investor Institute trading ideas and strategies videos here.


