

Traders will watch for a gap down this week. If one comes, then there will be an island top that began with the August 27 gap up. Alternatively, if there is an unusually big bear bar or consecutive big bear bars, that could be a measuring gap, says Dr. Al Brooks.
Monthly S&P 500 Emini futures candlestick chart:
Stalling just above the January all-time high
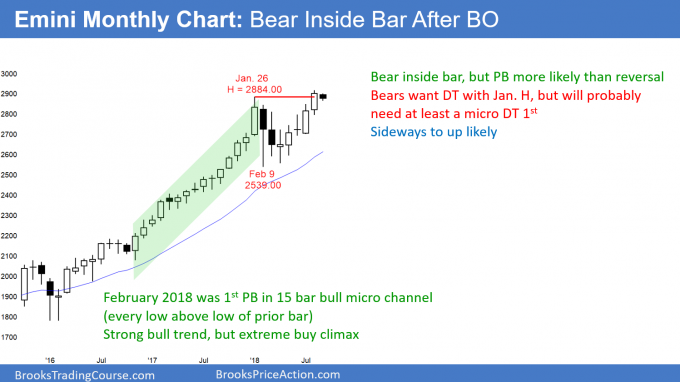
The candlestick so far this month on the monthly S&P 500 Emini futures candlestick chart is a bear inside bar. While the bears want a reversal, the bull trend is strong. September is more likely a pause in the bull trend than a setup for a bear trend reversal.
The monthly S&P 500 Emini futures candlestick chart has rallied for the past 5 months after the most extreme buy climax in the history of the stock market. September is currently a pause in the rally to a new high. The odds are that the pullback will last for only a month or two before the bull trend resumes. There are measured move targets around 3100 and 3200 on the weekly chart. The rally will probably reach them within a few months.
Weekly S&P 500 Emini futures candlestick chart:
Weak micro wedge sell signal
The weekly S&P 500 Emini futures candlestick chart triggered a minor sell signal this week by trading below last week’s low. The bears have a six-week micro wedge and a failed breakout above the January high. This week also closed last week’s gap up.
The weekly S&P 500 Emini futures candlestick chart is in a tight bull channel. However, the micro wedge of the past six weeks could lead to a 1 – 3-week pullback. Since the rally from the April low is strong, the 1st reversal down will probably be minor.
It is important to note that every leg down since January lasted only 1 – 3 weeks. That includes the big selloffs in February and March. There is no reason to believe that this week’s reversal down will be any different. The odds are that there are buyers below and that the bull trend will soon resume. The first support is the 20-week EMA which is around 2800. That is also around the June high.
Because September has a bad reputation as worst performing month of the year, traders are extra cautious. This increases the chances of a bigger pullback. For example, the gap above the 2766.25 July 6 high is another magnet below. However, the odds favor a rally up to the measured move targets around 3100 and 3200 before there is a test of the February low.
Daily S&P 500 Emini futures candlestick chart:
Emini exhaustion gap but minor higher high reversal
The daily S&P 500 Emini futures candlestick chart sold off in a 7-bar bear micro channel over the past two weeks. The odds are that it will continue sideways to down to one or both bull trend lines below.
Six days ago, the daily S&P 500 Emini futures candlestick chart reversed down from above the top of its five-month bull channel. While the 20-ay EMA is support, a channel reversal usually reaches the bottom of the channel before the bulls will return. The selloff might stop at the higher bull trend line. Even if it reaches the lower line, it will likely be just a bear leg in a bull trend.
The next support is the June 13 high just below 2800. The most recent major higher low is the June 28 low at 2693. No one knows where the end of the selloff will be, but there is only a 40% chance of a test of the April low, and only a 30% chance of a strong break below the February low. The bulls will buy any reversal up from even a strong reversal down and expect a new all-time high.
The bears want a strong break below both bull trend lines. They also want a break below a major higher low, like the August 2 low. They need to get consecutive big bear bars falling below support before traders will believe that the breakout above the January high has failed. Since the weekly and monthly bull trends are strong, the odds continue to favor the bulls. Traders will continue to buy every reversal down.
7-day bear micro channel means subtle selling pressure
Each of the past six days has a high below the high of the prior day. This is a 7-day bear micro channel. Even though the price has not fallen greatly, the bears have been in control for a long time. Every chart has two variables, price and time. Some trends begin slowly, which means that time can be more important before price falls sharply.
Why is every high a little lower? It is because traders correctly believe that there are sellers above the prior day’s high. The bears are so afraid of missing out on a short that they are beginning to sell any rally that gets near the prior day’s high.
This 7-day micro channel is a warning that the Emini could fall quickly the week pf Sept. 10. After an unknown number of days in a micro channel, both the bulls and bears agree that the bears own the market. Once that happens, the Emini could fall far and fast from a bear breakout below the 7-day bull flag (a bear channel is a bull flag). At the moment, there is a 40% chance of a successful bear breakout below the bear channel and a measured move down to around 2800.
Traders will watch for a gap down the week of Sept. 10. If one comes, then there will be an island top that began with the August 27 gap up. Alternatively, if there is an unusually big bear bar or consecutive big bear bars, that could be a measuring gap. The bears will sell, and the bulls will wait until the selloff has at least a couple legs down to support before buying again.


