

In part 1 of our commentary, we discussed the current Fundamental Gravity of our "Reflation Rollover" macro theme. If you missed part 1, I encourage you to read that first, before jumping into part 2, writes Landon Whaley. He's presenting at MoneyShow Dallas Oct. 4-5.
We covered a great deal of critical fundamental developments, which are bearishly impacting crude oil-related equities and the US-listed ETF, the VanEck Vectors Oil Services ETF (OIH).
Quantitative Gravity says what?
As a quick reminder, the Quantitative Gravity component of our Gravitational Framework is not technical analysis, which is ineffective and misleading. Rather, we use quantitative measures based on the reality that financial markets are a nonlinear, chaotic system.
We’ve identified four primary quantitative dimensions of financial markets that affect price movement: energy (trend), force (momentum), rate of force (buying pressure), and a market’s irregularity (level of imminent drawdown risk).
Social is our measure of a market’s current energy (or trend). OIH’s Social reading indicates it is in a hangover, which began in mid-June. Given the Fundamental Gravity, the most likely direction for OIH in the months ahead is further south.
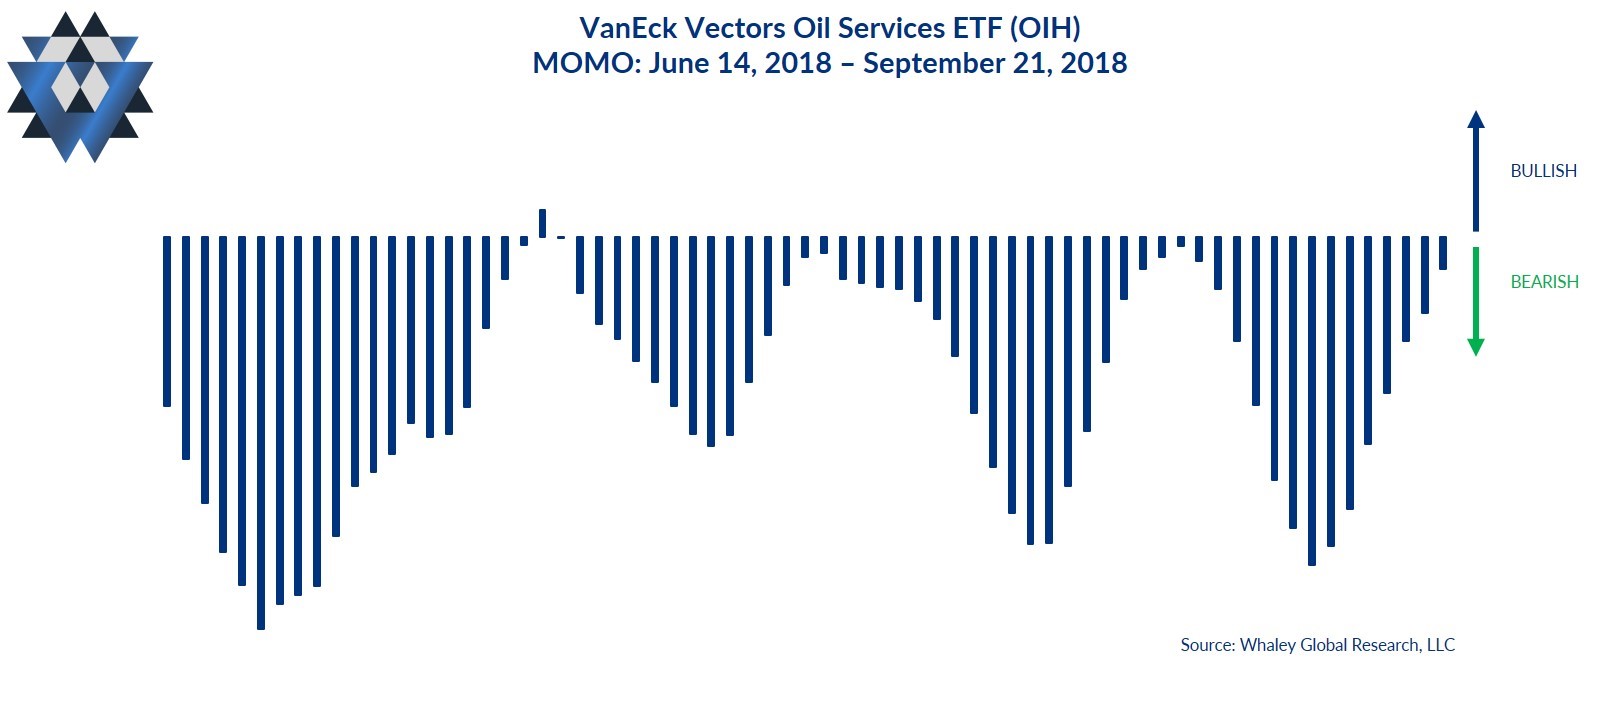
Momo is our measure of the amount of force behind the market’s current state. OIH’s Momo turned bearish on May 31 and has remained bearish ever since as OIH’s price makes a series of lower highs and lower lows.
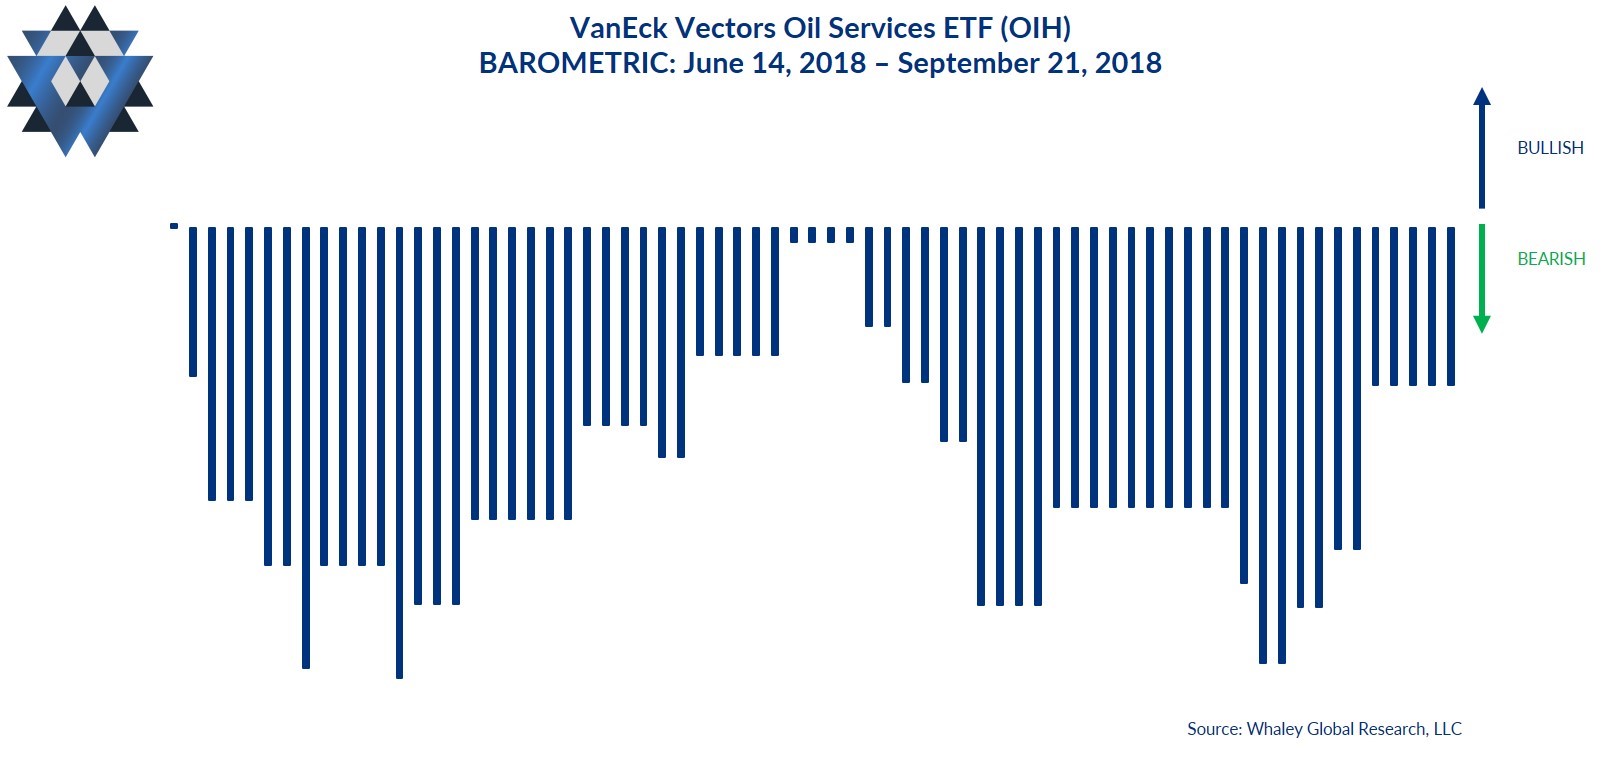
Barometric is our measure of buying and selling pressure or the rate of force behind the current Momo. OIH’s Barometric indicates that sellers have been firmly in control of this market since June 18 and their control is only becoming more profound.
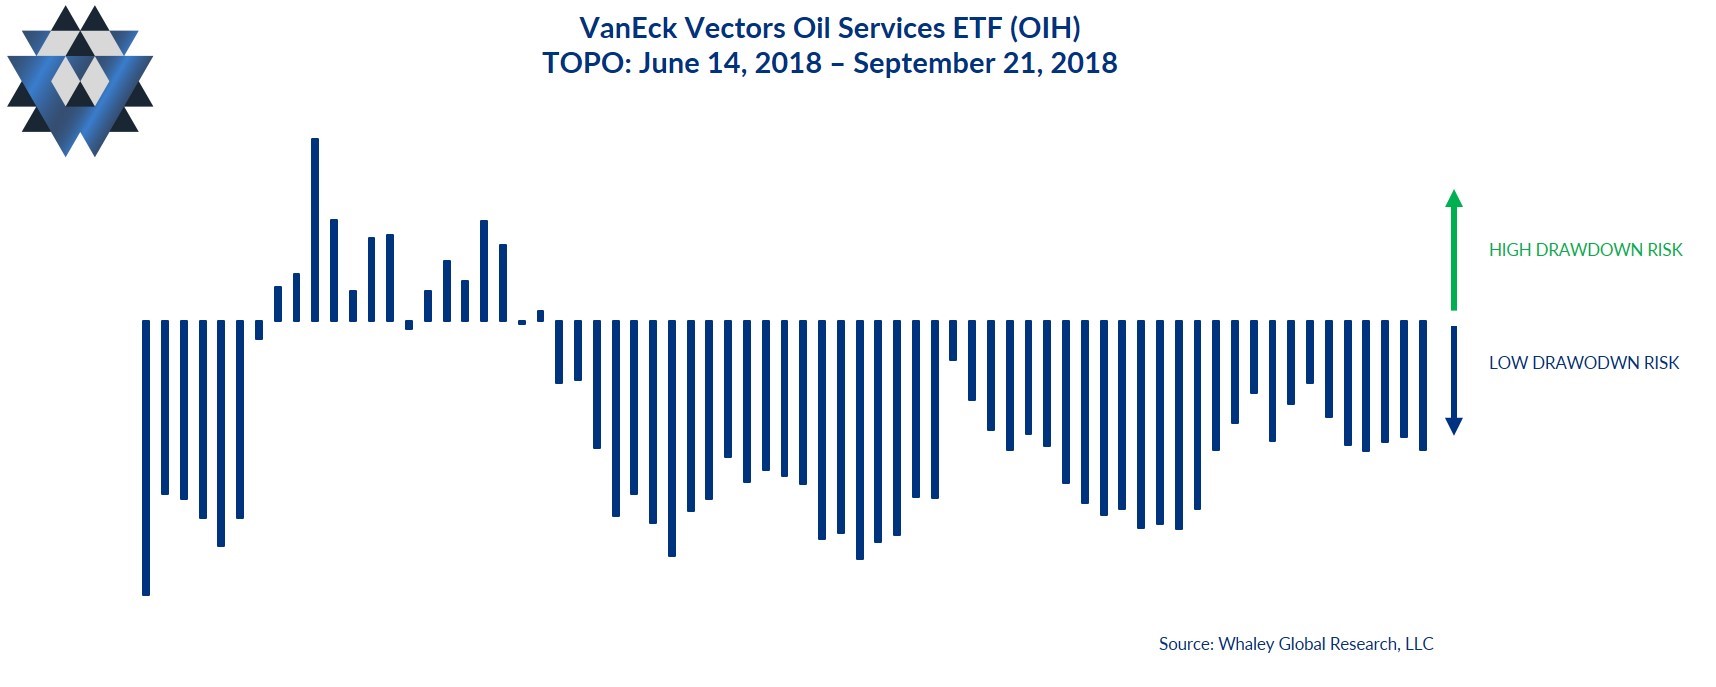
Topo, which measures the probability of a drawdown, is indicating a rising level of drawdown risk for OIH over the next 10 trading days. Drawdown risk spiked in early July but has been relatively low since July 26. Remember, what matters most occurs at the margin. It’s extremely bearish when TOPO moves from a territory of low risk to high risk, as we are seeing with OIH right now.
Alpine and Abyss Lines
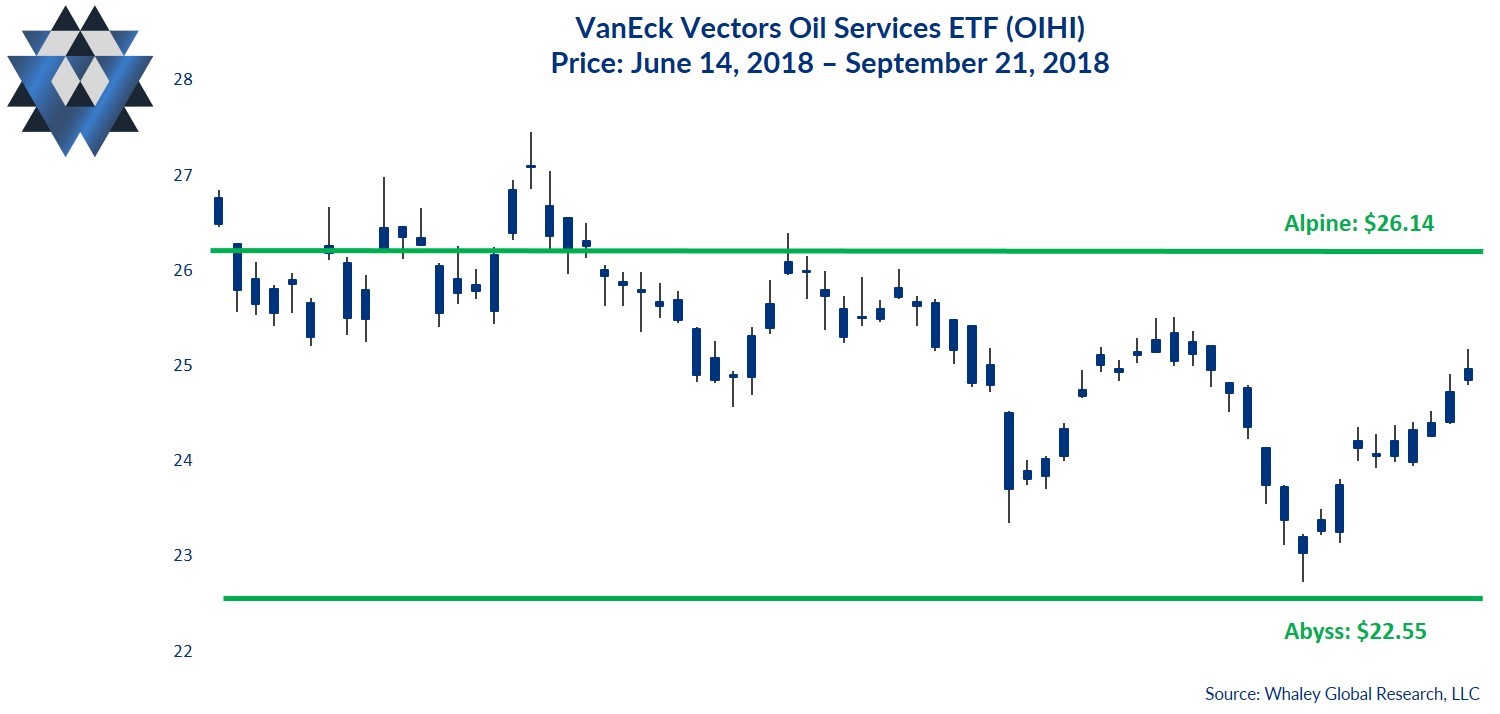
Our proprietary Alpine and Abyss lines are not “support” and “resistance.” Rather, they are the areas above and below the most recent closing price where price is likely to experience an acceleration in its current trajectory, or a possible reversal of its current course. We calculate these critical prices utilizing fractal geometry and Chaos Theory as the foundation to analyze the underlying market structure, which is not visible on a price chart.
When a particular market’s price interacts with the Alpine or Abyss areas, regardless of whether the price is rejected by the Alpine or Abyss area or is able to breakout above (or breakdown below) it, the outcome gives you critical insight into the most likely direction of that market.
The most critical Alpine area for OIH above Friday’s closing price is between $25.63 and $26.14. This means that it’s highly likely that any upside price momentum will stall at this area. However, if OIH closes decisively above that area, price is likely to accelerate higher from there.
The most critical Abyss area for OIH below Friday’s closing price is between $22.87 and $22.55. This means that it’s highly likely that any downside price momentum will stall at this area. However, if OIH closes decisively below that area, price is likely to accelerate lower from there.
The Quantitative Gravity bottom line is that all aspects of OIH’s QG are bearish. The most bearish development recently is TOPO beginning to rise off its lowest level in 12 months, indicating a high level of drawdown risk over the next few weeks.
Behavioral Gravity says what?
Behavioral Gravity allows us to evaluate investors’ perception of this market and how that perception changes and shifts over time.
The Behavioral Gravity Index (BGI) for OIH has been moderately bearish since the beginning of September. Since OIH peaked on May 28, investors have pulled just $170MM from the ETF, which represents less than 10% of its asset base.
The behavioral bottom line is that investors are turning bearish on OIH, but they aren’t nearly bearish enough given the current Fundamental Gravity. We are a long way from a consensus perspective for being short OIH, which means there is low behavioral risk to initiating or holding short positions.
The Trade Idea
As long as OIH trades below $26.14, new short trade ideas can be initiated opportunistically on rallies. Depending on your entry and how much room you want to give this trade idea to move, use a risk price between $25.32 and $26.14. That said, your risk price line in the sand is $26.14. If OIH closes above that price, exit any open trades. If the trade moves in your favor and OIH trades down to the $23.05 area, consider closing some, or all, of your position.
We are currently out of OIH in our Asset Allocation Model and will send out an alert if we get the right entry price that skews the reward-to-risk characteristics of the short trade in our favor.
In addition to providing detailed analysis and trade ideas like this commentary on a weekly basis, we also provide real-time email alerts whenever we add, or close, a position in our Asset Allocation model inside our Gravitational Edge report.
Please click here and sign up if you’d like to receive an email alert when we initiate our position in this market and to participate in a an eight-week free trial of our research offering, which consists of three weekly reports: Gravitational Edge, The 358, and The Weekender.


