

The Emini has oscillated around last year’s close all year, and it therefore is a very important price. Friday was a big bear day and last week was an outside down week. But, trading ranges resist breaking out, writes Dr. Al Brooks Saturday.
Therefore, the year probably will end up closing within the year’s trading range, either a little above or below last year’s close.
The Crude oil futures market had a sell climax. The bears are either exhausted or nearly exhausted. The chart will probably be in a $10 trading range for several weeks.
Reuters: S&P drops to 8-month low on global growth worries.
The euro/U.S. dollar (EUR/USD) daily Forex chart is at the apex of a triangle. Because the weekly chart has a wedge bull flag at support, the odds are slightly better for a measured move up to 1.18 than a measured move down to 1.09.
Crude oil Futures market:
Sell climax evolving into trading range.
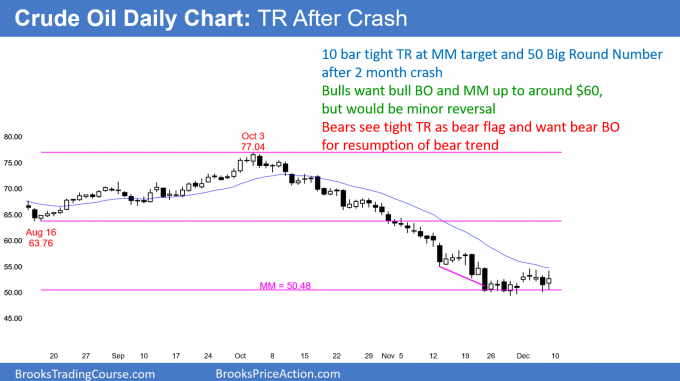
The crude oil futures daily chart is in a strong bear trend. After a wedge bottom at the $50 Big Round Number, it has begun to enter a trading range.
The crude oil futures market crashed over the past 2 months on the daily chart. It is now pausing at the $50 Big Round Number.
The 3 sell climaxes over the past month have created a wedge bottom. When there is a reversal up from a sell climax, traders typically look for at least 2 small legs up to around the 20-week EMA. In addition, they expect a test of the top of one or more of the sell climax bars.
Finally, when a sell climax is as extreme as this one has been, the bears are exhausted. This makes them resistant to selling again for anything other than a 1 to 5 day trade. The bulls know this and will therefore buy selloffs, looking for 3 to 5 day rallies.
With traders buying low, selling high, and taking quick profits, the chart evolves into a trading range. This process started 2 weeks ago. There is no sign yet that it is about to end. The odds are that the chart will stay sideways for at least a couple more weeks.
Only minor reversal up
The selloff was in a tight bear channel. There is therefore an 80% chance that the first reversal up will be minor. A minor reversal means a bear flag or a bull leg in a trading range.
A strong bear trend only has a 20% chance of reversing up into a bull trend without at least going sideways and forming a major trend reversal pattern. Consequently, the upside over the next month is probably only $10 – $15.
Can there be a strong break below $50? Probably not. The longer the daily chart goes sideways, the more traders will believe that the current price is just about right. The price will therefore be a magnet.
If there is a bear breakout the market might fall or a $5 – $10 measured move down. But a tight trading range late in a bear trend is often the Final Bear Flag. It is a magnet, and a breakout up or down usually gets drawn back to the range within 10 – 20 bars.
EUR/USD Forex weekly candlestick chart:
Triangle at support.
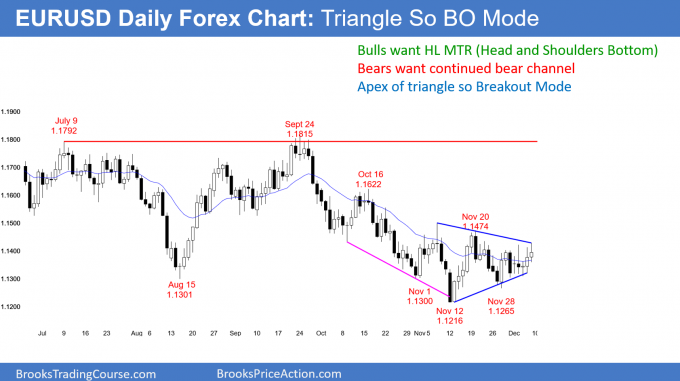
The EUR/USD daily Forex chart sold off strongly from the September high. It has been in a trading range for 2 months. The bears still have lower highs and lows. However, the bulls have a wedge bottom. The past month has formed a triangle.
The EUR/USD daily Forex chart is in Breakout Mode. Over the past month, there have been 2 lower highs and 2 higher lows. This is a triangle, and it is a sign of a balanced market. When there is a triangle, there is a 50% chance that the first breakout up or down will fail.
Reuters: Brexit in turmoil Monday as PM May pulls vote on her divorce deal.
In addition, once there is a successful breakout, there is about a 50% chance that it will be up and a 50% chance it will be down. The odds are probably slightly better for the bulls because the weekly chart (not shown) has a wedge bull flag at support.
Finally, the triangle is 300 pips tall. Traders will look for either a measured move down to 1.09 or up to 1.18 at the September high.
Does the market tip its hand before the breakout? Sometimes, but it is usually more profitable to take quick trades up and down until there is a breakout. Then, traders will be willing to hold for a bigger profit.
Monthly S&P500 Emini futures candlestick chart:
3-month tight trading range above 20-month EMA
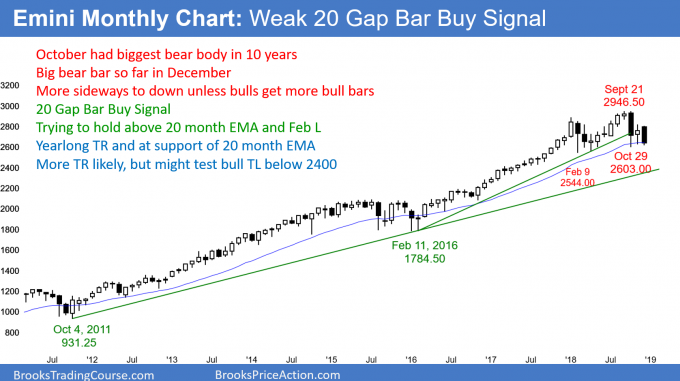
The monthly S&P 500 Emini futures candlestick chart has a bear bar so far in December. While it broke below the November low, it is holding at the 20-month EMA. Also, November was a doji bar with a bull body. It is therefore a weak sell signal bar.
The monthly S&P 500 Emini futures candlestick chart is in a trading range after a strong 10-year bull trend. October formed the biggest bear bar in over 100 bars on the monthly chart.
But, it had a tail on its bottom and held above the 20-month EMA. In fact, it was the first pullback to the 20-month EMA in more than 20 months. That is a 20 Gap Bar buy setup.
For almost 2 years, the bulls have been buying above the average price. There is a gap between the low of each bar and the moving average. In October, they finally got to buy at the average price instead of above it. The tail on the bottom of the October bar and the modest rally in November indicate that many bulls took the opportunity.
Yet, November did not close on its high. In addition, its bull body was small compared to the big bear body in October. This indicates that the bulls bought the 20-month moving average, but were not eager to buy much higher.
It also indicates that there were not many follow-through buyers. Furthermore, the weak close means that many bulls bought for a brief trade. They exited with a quick profit. Therefore, they are not confident that the reversal up from the average price will result in a resumption of the bull trend.
Weak buy setup
November had a bull body. In addition, it was an inside bar after a pullback to the EMA. It is therefore a High 1 buy signal bar for December. If December trades above November’s high, it will trigger the buy signal.
But, November did not close near its high. In addition, its body was small compared to the big bear body of October. This is a weak buy setup. A weak buy setup typically does not lead to a strong bull trend. There are usually more sellers than buyers not far above the buy signal bar.
As a result, most of the bulls who buy above November’s high plan to take quick profits. They plan to exit within 1 – 3 bars. Since this is a monthly chart, that means within a few months. Most will probably exit below the September high. This is because they expect that the bears will get at least a small second leg sideways to down after the big bear bar in October.
Weak sell setup
Since November was an inside bar, it represents balance. Traders are expecting a breakout up or down. Because it had a bull body and closed above the EMA, it is a weak sell signal bar. Most traders will not sell on a stop below November’s low. When Thursday fell below November’s low, it triggered the sell signal. But, the Emini reversed up sharply. On Friday, it again broke below the November low, but closed only slightly above it.
If December closes near its low, it would be a higher probability sell signal bar for next month. This is especially true if it closes below the 20-month EMA. Traders would then expect a test of the February low.
Trading ranges represent balance
The monthly chart has been in a trading range for a year. Trading ranges resist breaking out. Therefore, traders tend to take quick profits and bet on reversals (buy low, sell high, scalp). Even if there is a strong break below the February low and a test of the bull trend line at around 2,400, the selloff will probably reverse back up within a few months.
Likewise, if there is a break above the range, it will probably reverse back down within a few months.
A trading range in a bull trend is a bull flag. Consequently, the September high will probably not be the top of the bull market. But, trading ranges can last a long time. Therefore, the bulls might need 6 – 12 more months before they get their new high.
The bears know that the 9-bar double top is probably too small to reverse a bull trend that has lasted 100 bars. However, they want a strong minor reversal down to the monthly trend line. Will they get it? At the moment, they have a 40% chance.
Most likely, the trading range will continue for at least a few more months. The bulls do not yet have a good buy setup. And, a bear breakout will probably not last long.
Weekly S&P 500 Emini futures candlestick chart:
7 week tight trading range with double top and double bottom
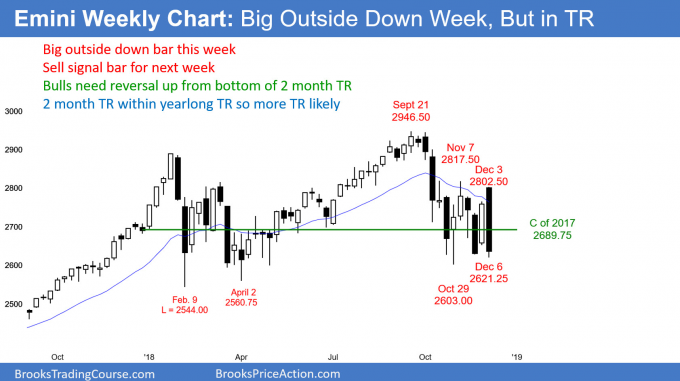
The weekly S&P 500 Emini futures candlestick chart traded above the previous week’s high and below the previous week’s low. This was therefore an outside down week. However, the chart is in a 7-week tight trading range. That range is in the middle of a yearlong trading range. There is no sign of a breakout up or down.
The bears see the October selloff on the weekly S&P 500 Emini futures candlestick chart as the start of a bear trend. November and December have formed a double top bear flag. This candlestick this week was an outside down bar. It is therefore a sell signal bar for this week (Dec. 10). If this week trades below last week’s low, it would trigger the sell signal.
But the weekly chart has been sideways for 7 weeks. A trading range resists breaking out. Therefore, the bears need a big bear bar this week before traders will believe that the October bear trend is resuming.
Without that, the odds continue to favor more sideways price action. Until there is a breakout, there is no breakout. Traders will bet on reversals and take quick profits until there is a clear, strong breakout up or down. If there is a breakout, it will probably fail within a few weeks.
A tight trading range is a limit order market. The bears are selling strong bull closes near the top and above bars near the top. The bulls are buying bear closes near the bottom and below bars near the bottom. Both are taking quick profits, doubting that any reversal will last more than a bar or two.
Daily S&P 500 Emini futures candlestick chart:
Emini sell and buy vacuum tests of 2017 close
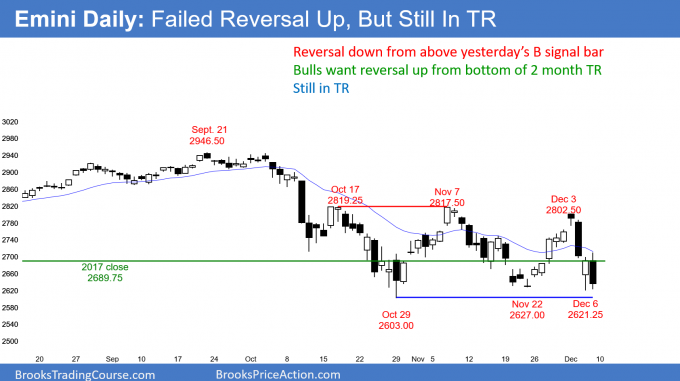
The daily S&P 500 Emini futures candlestick chart has had 3 lower highs and 3 lows in a trading range over the past 2 months. It is oscillating around the 2017 close. Friday was a big bear day, which increases the chance of a bear breakout this week (Dec. 10).
The daily S&P 500 Emini futures candlestick chart has been sideways for 2 months since the October selloff. I wrote repeatedly in the first half of the year that the chart was oscillating around last year’s close. It rallied to a new high in September, but collapsed back to last year’s close in October.
In early October, I once again began to talk about how important the market believes last year’s close is. If a market keeps coming back to a price, it is a strong magnet.
The bulls want 2018 to be another positive year. That would increase the chance of higher prices next year.
Yet, after a 10-year bull trend, the bears know that the bulls are getting exhausted. The bears want to create evidence that they are now strong. That would increase the chance of a swing down. One sign of strength would be a December close below last December’s close. The bears would then have able to erase all of the 2018 gains. It would increase the chance of an additional selloff in 2019.
Triangle
After the reversal down from the November 7 lower high, I said that there might be a reversal up from above the October low. That would be a higher low after a lower high and it could lead to a triangle. I wrote that the bears would need one more rally to reverse down. They got their reversal down on Tuesday.
Since Thursday and Friday broke below the November low, the triangle is having a bear breakout. When there is a breakout of a Breakout Mode pattern, there is a 50% chance that the 1st breakout will reverse.
While Friday was a big bear day, if there is no follow-through selling early next week, the bear breakout will fail. Once there is a successful breakout, traders look for a measured move. Because the range is about 200 points tall, the breakout target is either 3000 or 2400.
The importance of waiting until the end
When day trading on a 5-minute chart, traders will often notice that a bar dramatically changes its appearance in the final seconds. A strong bull bar can quickly reverse down and close on the low, turning the bar into a strong bear bar. A developing bear bar can suddenly become a strong bull bar.
This is true on all time frames. For example, if the day has been a trading range day, the market will often get quickly drawn to the open of the day in the final hour.
Traders will see this behavior on any higher time frame chart. At the end of the week or month, the market often gets pulled to weekly or monthly support or resistance.
While I do not have a yearly chart of the Emini, the same idea applies. The open of the year has been important all year. We are now at the end of the year. Tuesday’s selloff was a sell vacuum test of the open of the year. Thursday’s rally tested it from below.
In situations like this, the chart often oscillates around the magnet until the final 4 – 5 bars. It then either rallies strongly above it or sells off far below. Therefore, the final week of the year could have a surprisingly big move up or down.
Trading Room
Traders can see the end of the day bar-by-bar price action report by signing up for free at BrooksPriceAction.com. I talk about the detailed Emini price action real-time throughout the day in the BrooksPriceAction.com trading room. We offer a 2 day free trial.


