
The power of the COT signal multiply when the daily and weekly reports line up as they have in gold, silver and the Treasury complex, says Andy Waldock, who will be presenting at the TradersEXPO New York on March 10-12.
The markets have provided a timely instructional piece for analyzing the weekly Commitments of Traders (COT) report in conjunction with daily prices. We use the weekly COT data as the backdrop for daily technical analysis and market setups. The power of the COT signals comes to light when the daily and weekly reports line up as they have in gold, silver and cotton over the last couple of weeks.
Two weeks ago, we stated, “The gold market’s breakout above $1,325 should signal the last of the near-term strength. We expect gold to run out of gas near month end somewhere between $1,330 and $1,350.”
Precious metals
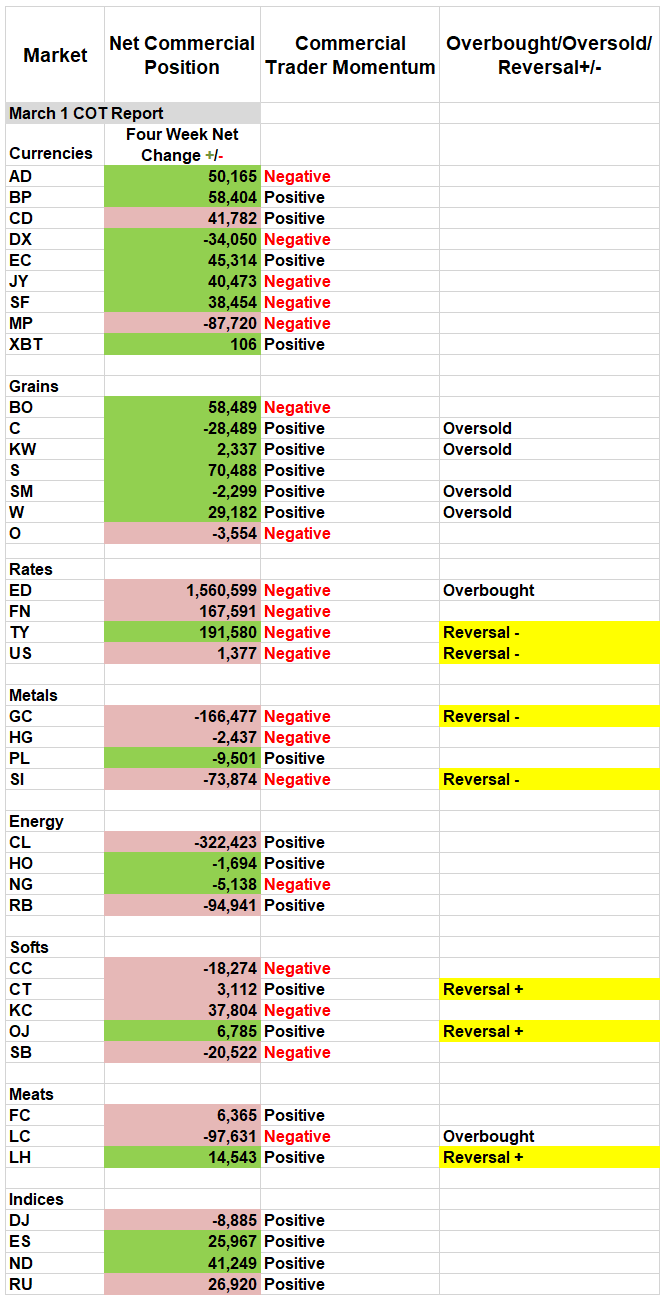
Last week continued the hot streak as the anticipated declines in gold and silver continued to pay off. Daily COT Signal subscribers were issued short sale signals in both gold and silver for trading on Feb. 22. Gold made a high at $1,349 and has closed lower every day since the short sale recommendation. Now, we’re getting confirmation on the weekly chart, as well. We expect these reversals to last at least a few weeks, thus making the weekly COT signals worthwhile to commodity-based exchange traded fund (ETF) traders in products like SPDR Gold Trust (GLD) or iShares Silver Trust (SLV).
Treasury complex
Last week also gave us the downward movement we were expecting in the Japanese yen futures along with the cracks we’ve been waiting for in the interest rate complex. We’ve been anxiously watching the interest rate sector’s consolidation because the commercial traders’ heavy selling is suggesting we’re near the top of the price rally that began last October. The sideways movement in the interest rates has caused the daily signals to revert to neutral. However, the weekly timeframe has generated clear short sale signals in both the 10- years Treasury notes and the 30-year Treasury bond.
The consolidation and corresponding decrease in volatility do provide the added advantage of tighter protective stop placement. Since this is a pattern-based reversal methodology, we only risk a trade to its nearest extreme price. Therefore, the protective buy stop for the June 10-year Treasury note and the June 30-year Treasury bond should be placed at 123-17.5 and 147-31, respectively. We may be at an optimal point in the market to think long-term about the interest rate sector. Remember that we are expecting Treasury prices to fall, which requires an inverse ETF, like, Barclay Bank IPAT US TR 10 YR BEAR ETN (DTYS) or, Direxion SHS ET/Daily 20+ YR T Bear (TYBS).
We also have a trade in the cotton market this week, and while there is an ETF focused on the cotton market, BAL, I’m not sure there is enough volume to make it worth trading. However, commercial traders in cotton are now net long for the first time since April of 2016. This was one month after the market made its lowest low since 2010. Cotton processors are eager to lock in future inputs at today’s prices. These are precisely the types of setups that COT analysis defines. We sent a daily COT buy signal for Feb. 20. The market’s strong close on Friday has now triggered a weekly COT buy signal buying May cotton and placing a protective sell stop at the recent low of 71.01.