

The VIX has true competition in the volatility space with SPIKES, writes Jay Soloff.
It’s always fascinating to watch how the market reacts to changes in volatility. It seems like the crowd is always waiting for the other shoe to drop. It’s as if market volatility can’t ever trade at an equilibrium – it’s either too high or too low.
When volatility is high, you get a fair amount of traders scrambling to sell it. Shorting volatility is a popular trade and traders don’t generally believe elevated volatility will remain (elevated). For the most part, this is true – although the last three months of 2018 showed that quick reversion of market volatility isn’t always the case.
On the other hand, there are many traders who aren’t satisfied with low volatility. They feel that it underprices market risk and could spike up at any time. This is also true often enough – however low volatility environments can persist for a very long time, just look at a VIC chart from 2017.
Why are so many traders quick to assume volatility is too high or too low? Part of the reason is that volatility has more predictable mean reverting characteristics than stock prices. In other words, market volatility tends to return to its average price more quickly than stocks do.
It’s one reason why the Cboe Volatility Index (VIX) is such a popular instrument to trade. As I mentioned in this article, the VIX now has some competition with the introduction of the MIAX and T3 Index SPIKES volatility index. SPIKES is very similar to VIX, except it uses SPY options instead of SPX options as the underlying vehicle to calculate market volatility.
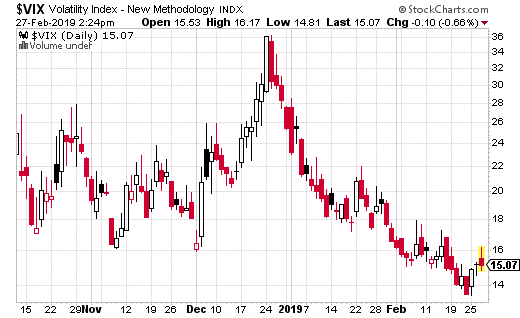
How similar is SPIKES to VIX? In most circumstances, the value of the two should be very similar. For example, recently, the VIX was trading at 14.90 and SPIKES is at 14.95. The biggest variations will come near periods when SPY goes ex-dividend.
Okay, so we saw the index values are similar, but what options prices? How close are they? Let’s look at an example.
I recently came across a massive April VIX trade, one which makes money if market volatility jumps higher. The trader purchased the VIX April 20-30 call spread for around $0.50 (buying the 20 call, selling the 30 call). Here’s the thing— the trade was executed 150,000 times.
That means max loss on the trade is $7.5 million if VIX is under 20 by April expiration. Breakeven is at 20.50, and max gain is at 30. Max gain will result in profits of $142.5 million. A trade like this could be a large hedge against a long stock portfolio, a bet that volatility is going higher, or part of a relative volatility strategy (because the VIX options may have been considered inexpensive).
Okay, so what if you wanted to make that same trade in SPIKES options? I looked at the price of the VIX April 20-30 spread and it’s trading for right around $0.65. Looking at the same trade in SPIKES and it’s trading for about $0.65.
Now, the prices won’t always line up, but it should be pretty close most of the time. One of the big differences between the two is the fees for SPIKES are less than the fees for VIX. That could make a big difference for a trader/fund who’s doing 150,000 spreads at once.
Bottom line, the VIX has true competition in the volatility space with SPIKES. The value of the VIX and SPIKES should remain similar most of the time. However, the lower fees from MIAX should help drive liquidity to SPIKES options over time.


