

A large gold ETF spread provides clues on the direction of the shiny metal, writes Jay Soloff.
Economic conditions have taken center stage over the last week, with the word “recession” popping up in financial headlines. The Fed has recently said it doesn’t plan to raise rates in 2019 and the investment crowd wants to know why. Not to mention, we’ve had the dreaded “inverted yield curve” signal which often is a prelude to a recession.
What we’re not seeing much discussion of is how interest rates and economic news may impact the price of gold. Not all that long ago, you wouldn’t see a headline about interest rates or yield curves without another article regarding gold. These days, most commodity news is focused on oil (and rightfully so) but gold can be an important store of value for risk averse investors.
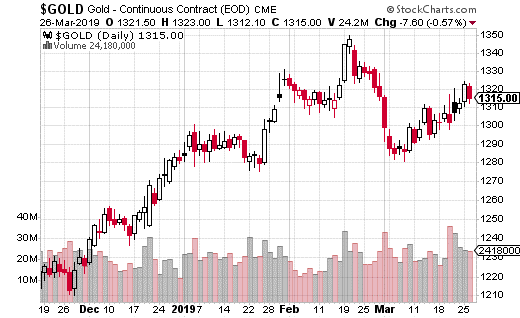
The price of gold has also picked up some volatility in recent weeks. From April to October last year, gold was in a relatively slow downtrend. The trend reversed in November, with the price climbing until the end of February. But the action has picked up the last several weeks with gold in a range from $1,350 an ounce to about $1,275 and now back to the middle of that range.
Certainly, interest rate policy is having an impact on the price of the precious metal. As gold is essentially a currency, it tends to move when interest rates (and the dollar) move. But, with interest rates not expected to rise through 2019, the catalyst for gold moves may be contingent on other types of economic data.
Besides gold itself, gold miners are clearly affected whenever gold prices move. One common and widely popular way to trade gold miners is through the VanEck Vectors Gold Miners ETF (GDX). GDX trades about 45 million shares a day on average, pays a small dividend, and with a share price of just around $23, can be quite a bit more affordable than physical gold.
So, what is GDX telling us about the expected price of gold? Let’s look at the options action for clues.
A very large trader sold 50,000 September GDX 25-27 call spreads with the stock around $23. Selling a call spread is selling the more expensive call (25 in this case) and buying the cheaper call (27) for protection.
The call spread seller collected about 50¢ for this trade, which amounts to $2.5 million in premium for 50,000 spreads. The trader keeps all of that premium if GDX is below $25 at September expiration. Max loss occurs at $27, with breakeven at $25.50. That means the most the trade can lose is $1.50, which is $7.5 million on 50,000 lots.
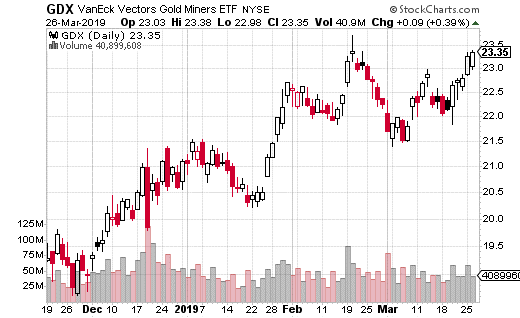
So why do a trade like this? The trader must believe gold has a ceiling that’s about 10% higher than where we are now. This trader also may believe gold doesn’t have much downside either, hence selling the call spread instead of buying a put.
Basically, selling a call spread is more of a market neutral trade with a bearish bias. If you believe gold has a ceiling but not much downside, a trade like this may be the right one for you. Just be aware that with any credit spread, you need to have a margin account established with your broker.


