

Last week’s volatility eclipsed the entire range of April, making May an outside down month, writes Al Brooks.
The E-mini S&P 500 futures formed a micro double top on a monthly chart at important resistance last week. If the bulls get follow-through buying this week, there will probably be a test of 3,000 in May.
The E-mini futures traded above the April high and then below the April low. May is therefore an outside down month. In addition, it formed a double top with the September all-time high (see chart).
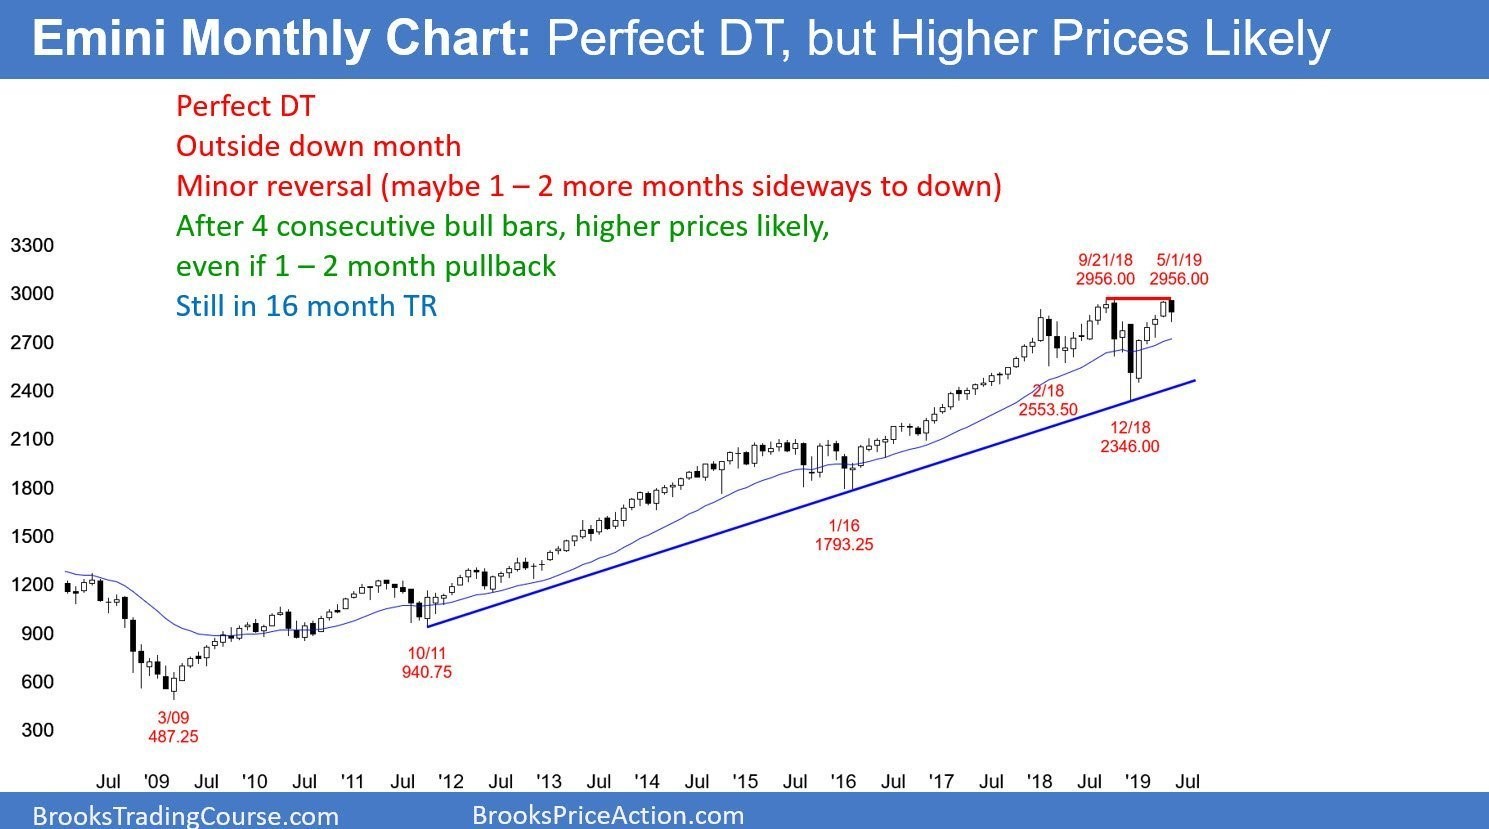
However, there were four consecutive bull bars closing near their highs. In addition, the December selloff was simply a pullback to the 20-month exponential moving average in a strong bull trend. Consequently, there are probably more buyers than sellers below the April low.
This is a low probability top. Traders should expect a new all-time high within a month or two. Since there are several weeks left in May, the bulls might get their new high this month. If so, May would then go back above the April high. As a result, it would become an outside up bar after first being an outside down bar.
That would slightly increase the chance of higher prices this summer. But the multiple reversals mean there is balance between the bulls and bears. It increases the chance of June largely overlapping April and May.
The strong first four months of the year make it unlikely that the bears can get more than a few months of sideways to down trading. However, the E-mini is now at the top of a 16-month trading range. Markets have inertia. This means they resist change. Traders should assume that the current market condition will continue indefinitely until it clearly has changed.
This means that a break to a new high will probably not last more than a few bars before there is a pullback into the range. Since this is a monthly chart, a few bars equal several months. It can also mean a couple hundred points. Therefore, in addition to not much downside risk, there is probably not much upside potential either this year.
Traders will soon realize that the downside risk to the December low is more than the upside potential above the all-time high. This will make them hesitate to buy much above the September high.
E-mini transitioning into 10-year trading range
The 16-month trading range will probably get a higher high, but not much higher. A reversal down would form an expanding triangle top. That is a variation of a higher high major trend reversal.
It is important to note that major reversal patterns only actually lead to a major reversal 40% of the time. Therefore the 16-month range will probably continue for many more months.
Furthermore, the stock market has been in a huge 10-year bull trend. Also, there is a major top on the monthly chart in the bond market. The E-mini is probably in the early stages of a huge trading range that could last a decade, like from 1998 to 2009 and 1965 to1980.
During those times, there were several 30% to 50% selloffs and rallies of 50% to 100%. There is money to be made when buying low and taking profits near the high. However, buy and hold traders will probably not make much money over the next 10 years.
Consecutive doji bars after double top
The weekly S&P 500 E-mini futures chart formed doji bars over the past two weeks. The bears want a trend reversal down from the double top (see chart).
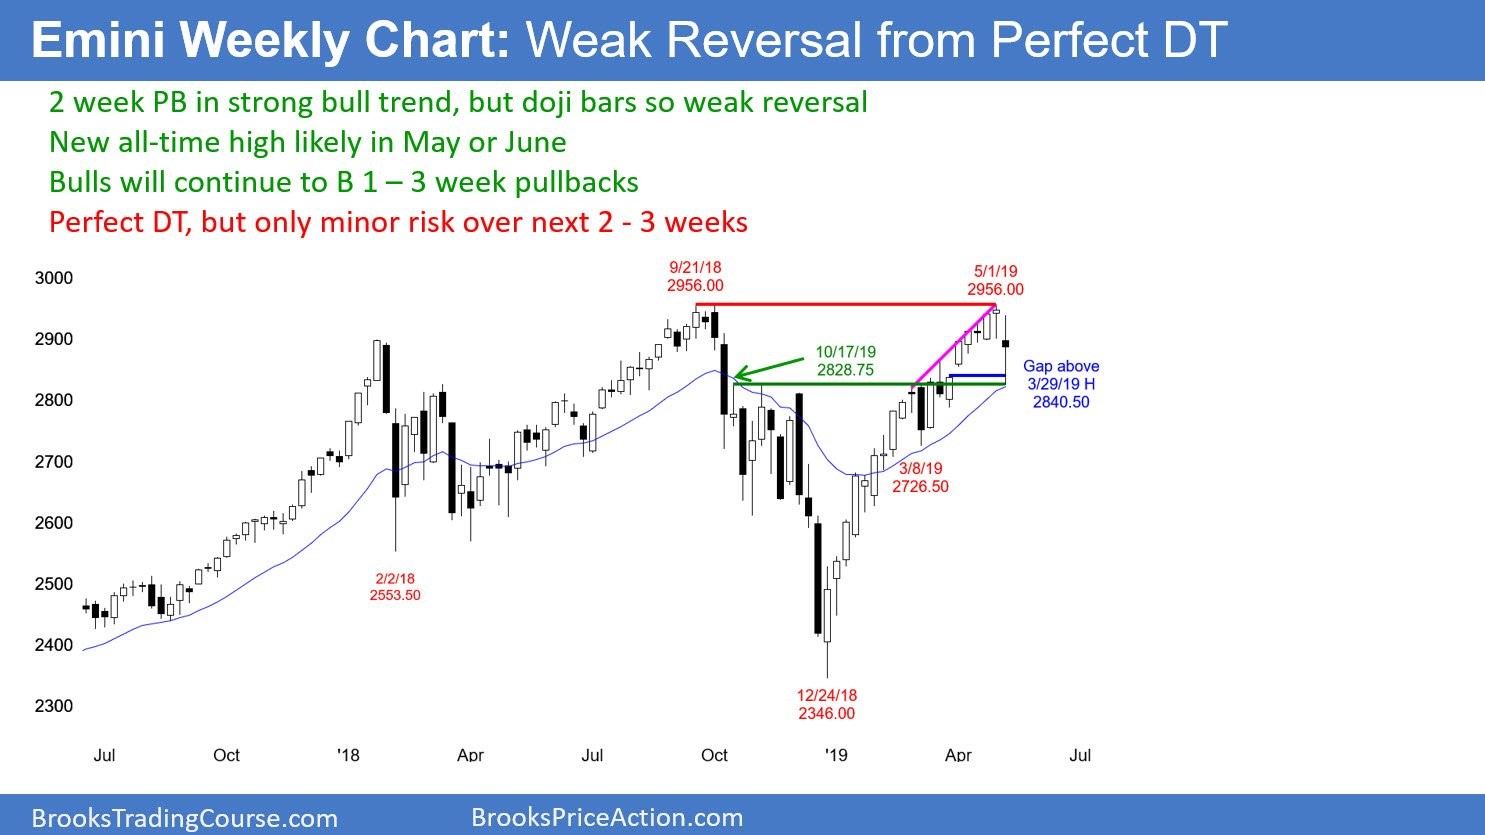
However, last week was a bull doji bar. That is a low probability sell signal. While this week had a bear body, it was small. The week was another doji bar with a big tail below. This is a bad entry bar for the bears. In addition, the four-month bull trend is strong. Consequently, the weekly chart does not currently have much downside risk.
The two dojis represent balance. Traders are not rejecting the all-time high as too expensive. They are also not yet buying aggressively.
Last week was a pullback in a four-month trend. That makes it a High 1 bull flag. But a bear doji is a weak buy signal bar. There might be more sellers than buyers above its high, just as there were more buyers than sellers below last week’s low.
This could result in a few more weeks of sideways to down trading before a new high. The absence of a credible top or strong reversal down make higher prices likely soon.
Pullback testing major support at 2018 triple top on daily
The daily S&P 500 E-mini futures chart had consecutive outside bars eight days ago. At that time, I said that it was a reliable sell setup. I said that traders should expect at least a couple legs down for two to three weeks, and possibly a couple months (see chart).
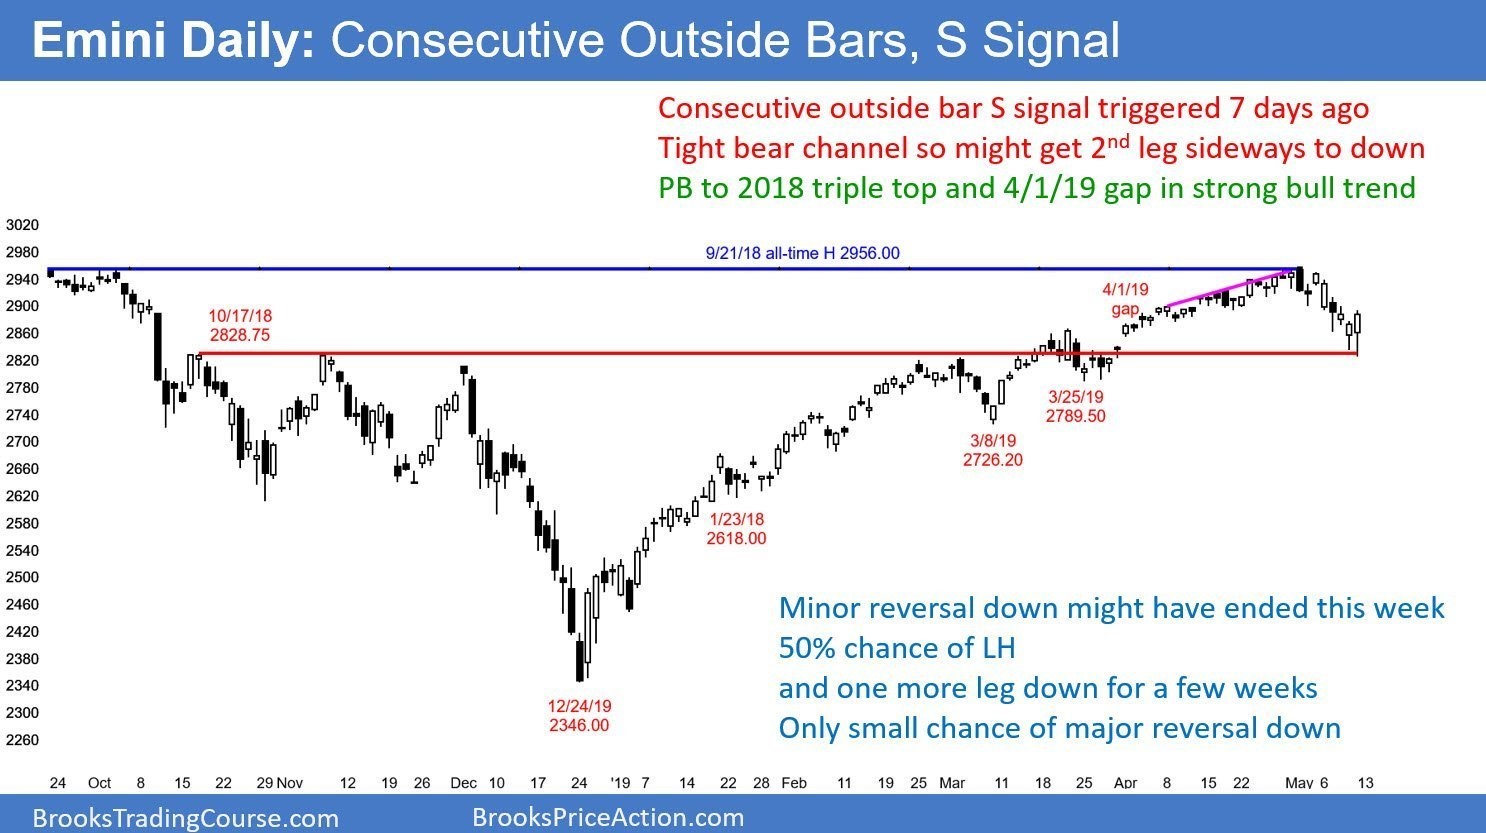
In addition, I talked about the targets below. I wrote that the pullback would dip below the March 21 high and probably would close the gap above the March 29 high. That would also result is a breakout pullback test of the October-November-December triple top.
The bears achieved all of those objectives last week. They always want more. They would like to get down to the March low, a 50% retracement, or even the December low.
Buy signal, but possibly more trading range
Friday was a big outside up day. It followed a good bull day on Thursday. This is a micro double bottom and it is at important support.
Friday is a buy signal bar for today. This pullback is about the size of prior pullbacks in 2019. The all-time high is a strong magnet above. Therefore, traders are wondering if the pullback ended last week.
They will find out early this week. If the bulls get a series of bull bars closing near their highs, especially if the bars are big, they will probably get their new high in May.
Alternatively, if today is an inside day, or if it goes above Friday’s high but has a bear body or a close in the middle, the E-mini will probably go sideways for a few days. Traders will wonder if the chart will form a lower high and then fall for a second leg down.
Because the micro double bottom was strong and at important support, a break below would have a 50% chance of a measured move down. That would be around 2700 and a 50% retracement of the 2019 rally. At the moment, it is more likely that the E-mini will make a new high before falling far below the May low.
Risk of second leg down
That final target is unlikely without first seeing a new all-time high. However, the eight-day bear channel has been tight. In addition, a consecutive outside bar top sometimes leads to a selloff that lasts more than 20 bars. Therefore, traders will watch to see if any rally over the next week or two begins to stall below the all-time high.
If so and if there is a bear bar closing near its low, traders will have a swing sell setup. If that were to happen, many of the bulls who held through this first leg down would wonder if the selloff would reach those lower targets.
This could result in chain reaction selling. As the selloff begins, it could scare an increasing number of bulls out of their longs. Theirs is a crowded trade. If many sell at the same time, the result could be a panic selloff similar to the one in December. But, the 2019 bull trend has been strong. In addition, the 16-month trading range is within a 10-year bull trend. Therefore, even if there is a surprisingly quick selloff to 2600, the bulls would still probably buy it, like they bought the December crash.
Big double top, but small risk
There is a double top on the monthly chart. But the 2019 rally was exceptionally strong, and it followed a reversal up from a monthly bull trend line. Consequently, there is currently only a 30% chance that this double top will lead to a strong break below the December low.
Trading Room
Traders can see the end of the day bar-by-bar price action report by signing up for free at BrooksPriceAction.com. I talk about the detailed E-mini price action real-time throughout the day in the BrooksPriceAction.com trading room. We offer a two-day free trial.


