

Crude oil had a surprisingly big bear breakout last week. The odds favor at least a small second leg down, writes Al Brooks.
The crude oil futures market sold off sharply last week. There looks to be at least one more leg down after the selloff to the May 6 low. Last week met that goal see chart).
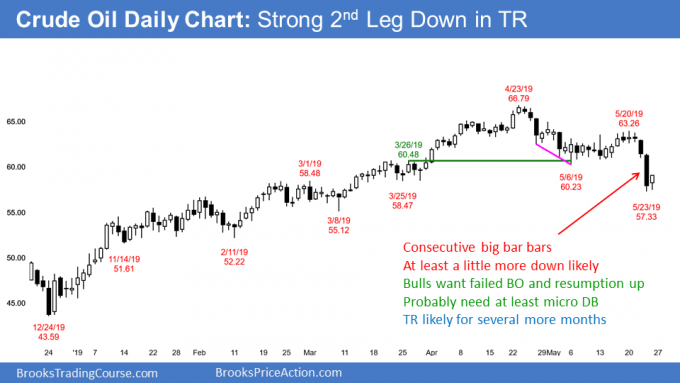
In addition, I noted that the selloff might continue down to the start of the three-month bull channel. That channel began with the Jan. 14 pullback. Its low is $51.61.
Finally, I have been saying that the selloff would be a bear leg in a trading range that would probably last many months. That is still likely.
Trading range for several months
When traders think that a market has entered a trading range, they prefer to sell rallies and buy selloffs. Will they buy last week’s selloff? Thursday was a surprisingly big bear bar. A Bear Surprise Bar typically has at least a small second leg down. Therefore, even if there is a rally for a few days next week, the odds favor at least a small second leg down.
Trading ranges tend to reward limit order traders. They are traders who buy low, sell high, and scalp. They bet against trends.
In a trading range, breakouts usually pull back to test breakout points. Therefore, the bulls who bought the May 6 low of $60.23 will probably be able to avoid a loss if they scale in lower.
Traders expect a test of that low over the next couple weeks. This is especially true because it is also just above the $60 round number.
However, whether or not crude oil tests $60 this week, the odds favor at least a small second leg down after last week’s bear breakout. It might lead to a measured move down to the Jan. 14 low.
Trading Room
Traders can see the end of the day bar-by-bar price action report by signing up for free at BrooksPriceAction.com. I talk about the detailed E-mini price action real-time throughout the day in the BrooksPriceAction.com trading room. We offer a two-day free trial.


