

The selloff in E-mini S&P 500 futures is in search of a bottom of its five-week bear leg in its 18-month trading range, writes Al Brooks.
A reasonable target is the gap above the Feb. 11 high. Also, a 50% retracement of the 2019 rally would be about a 10% correction. The bulls will then probably get another test of the all-time high within a couple months.
The monthly E-mini S&P 500 futures in May reversed down from above the April high and closed below the April low. May is therefore an outside down month. Furthermore, it formed a double top with the September all-time high. May’s candlestick is now a sell signal bar for that double top (see chart).
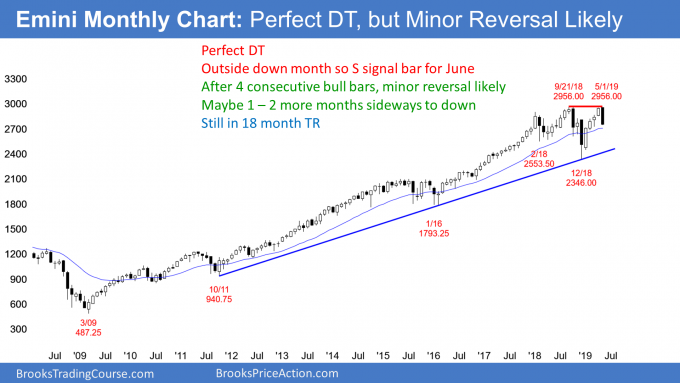
When there is a double top, the second leg up is often very strong. The January to April rally is an example. Yet, if there is a bear sell signal bar like there is in May, the next bar triggers the sell signal if it trades below the sell signal bar low. Therefore, if June trades below the May low, it will trigger the sell signal for the double top.
In 60% of instances, the market continues in its trading range. This is true even if it breaks below the neckline of the double top. That is the December low. The breakout usually fails and the trading range continues.
However, there is a 40% chance that the break below the May low will lead to a swing down. It could fall well below the middle of the 18-month trading range and even test the December low.
While it might be difficult, at the moment, to imagine the sell signal would give the E-mini a 30% chance of breaking far below the December low and falling for a measured move down. That would be a test of the 2014 – 2015 trading range around 2,000.
Pullback more likely than trend reversal
Currently, a two- to three-month pullback is likely. That is a minor reversal. The odds still favor a new all-time high this year.
However, this 18-month trading range is coming late in a bull trend on the monthly chart. It is therefore a good candidate for the Final Bull Flag. Therefore, if the bulls get a break above the double top, it will probably be the final rally in the 10-year bull trend.
The E-mini will probably correct down to the 2014/2015 trading range at some point in the next several years. At that point, it will probably enter a big trading range that could last for a decade.
Trading ranges typically follow big bull trends. Since this is the monthly chart, the trading range can last many years. That happened from 1965 to 1982 and again from 1997 to 2012. During those trading ranges, there were several selloffs of 30% to 50% and rallies of 50% to 100%. Traders should expect this to begin again at some point in the next few years.
Weekly E-mini Chart Analysis

The weekly E-mini S&P 500 futures chart triggered a sell signal when last week traded below the previous week’s low. However, last week was a doji bar. That is a weak sell signal bar. Furthermore, the past four weeks all had prominent tails. That is not how a bear trend typically begins. That lack of momentum and the weak sell signal bar make a protracted, deep selloff unlikely.
This week was the entry bar for the sell signal. Because it was a bear bar closing below last week’s low, there is an increased chance of lower prices over the next few weeks.
However, each bar for the past four weeks had a high below the high of the prior bar. This is a five-bar bear micro channel. The bears hope it is an early bear trend. But the prominent tails on the bars represents a lack of conviction on the part of the sellers. Consequently, the micro channel will probably end within the next few weeks. That means that the high of a bar will be above the high of the prior bar.
First reversal up from bear micro channel will be minor
It is important to realize that the first reversal up in a five-bar bear micro channel is typically minor. Traders will expect a one- to three-week rally and then a test back down. This limits the upside for the next several weeks.
The lack of consecutive big bear bars closing near their lows limits the downside.
What’s left? A trading range. This selloff is probably a bear leg in a developing trading range.
Disappointment and confusion are hallmarks of a trading range
Traders know that trading ranges can last longer and fall further than what seems reasonable. Trading ranges typically disappoint bulls and bears by forming breakouts that reverse instead of continuing into a trend.
Also, the lack of clarity confuses traders. The probability of everything is less than in a trend. Reversals often do not have strong signal bars. Legs up and down typically continue further than what seems likely. Breakouts of prior swing highs and lows reverse.
There is only one thing that traders see as high probability. Reversals are more common than breakouts. Consequently, they buy low and buy lower. They are betting against a bear trend. Also, they sell high and sell more higher, betting against a bull trend. Finally, since they expect reversals, they are quick to take profits.
The result of traders buying low, selling high, and taking quick profits is a trading range. The weekly chart is in the early stages of a trading range. There is no sign that it is about to end.
Daily E-mini Chart Analysis
The daily E-mini S&P500 chart last week broke below the bottom of the three-month trading range. It also broke below the 2800 Big Round Number. The trading range was a head and shoulders top, which is always a lower high major trend reversal. Last week triggered the major trend reversal sell signal by breaking below the neckline of the head and shoulders top (see chart).
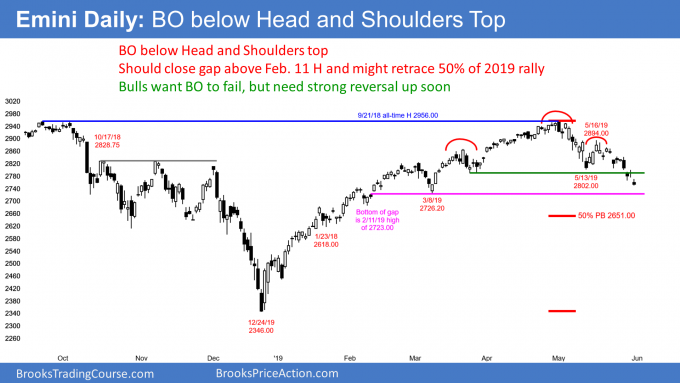
It is important to realize that a major trend reversal sell signal only becomes a major trend reversal 40% of the time. More often, the breakout soon reverses back up and the trading range continues or the bull trend resumes.
Support around 2650
There is no credible sign of a reversal up yet. Furthermore, there are important magnets below. The first is the gap above the Feb. 11 high of 2723.00. Next, a 10% correction is at 2660.40. Finally, a 50% retracement of the 2019 rally is just below at 2651.00.
Many bulls would be more confident that the selloff is over if it continues down to just below those targets and then reverses up. If it reverses up before then, the bulls will feel that the E-mini had not tested important support. This will make them hesitant to buy as the E-mini rallies. That relative lack of buyers could then lead to a lower high and a test of that important support.
Will the selloff end soon?
Can the E-mini rally up to a new high from where it is now? That is unlikely. The selloff has been in a tight bear channel. The first reversal up from a tight bear channel is typically minor. Traders will want to see a test down and then a second reversal up before they will believe that the bull trend is resuming.
Less often, a minor reversal can continue up and become major. The bulls would need to see several big bull bars closing near their highs before they would be confident that the selloff has ended.
In the meantime, traders believe that the selloff is a pullback in a bull trend and not the start of a bear trend. However, there is no credible bottom and there are targets below. This uncertainty will probably lead to a trading range over the next several weeks. It could last many more months.
The most recent leg down has lasted about two weeks. That is similar to the first leg down to the May 13 low. That increases the chance of a bounce for several days this coming week.
Trading Room
Traders can see the end of the day bar-by-bar price action report by signing up for free at BrooksPriceAction.com. I talk about the detailed E-mini price action real-time throughout the day in the BrooksPriceAction.com trading room. We offer a two-day free trial.


