

Crude oil is selling off sharply but it is entering the buy zone. The rally will probably be minor, last two to three weeks, and test $60.
The crude oil futures contract sold off sharply over the past two weeks. For the six weeks, I have been saying that the selloff might continue down to the Jan. 14 low of $51.61. That was the first pullback on the daily chart from the strong reversal up from the end of December. It was therefore the start of the bull channel in a four-month Spike and Channel bull trend (see chart).
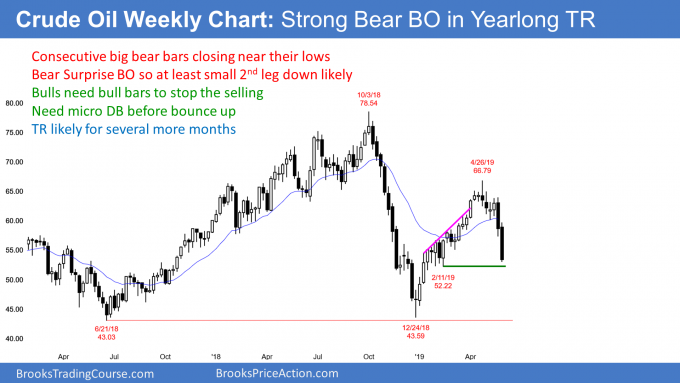
I pointed out in March and April that there is typically a bear break below the bull channel and then a transition into a trading range. The bottom of the range is often around the start of the bull channel. But it could be higher or lower.
There are two scenarios that are unlikely. First, crude oil’s two-month selloff will probably not continue down to the Christmas low without at least a several week rebound rally. The selloff is probably a bear leg in a developing trading range and not the start of a bear trend.
Next, once there is a reversal up, it will probably not continue up to the October high with at least a pullback lasting several weeks. Remember, the entire 2019 rally was probably the start of a trading range that could last for the rest of the year.
Consequently, traders expect rallies and selloffs to reverse instead of leading to trends. They therefore buy as crude oil falls, sell as it rallies, and take quick profits. This creates a trading range.
When will there be a bull trend reversal?
The current two-month selloff is in search of a bottom. Last week’s big bear breakout was a pair of Bear Surprise Bars. That typically leads to at least a small second leg down. This week met the minimum objective.
Big bars often attract profit takers. Therefore, the bears will probably begin to take profits within a couple of weeks. The bulls know this and they will begin to buy.
The next support is the March 8 low of $55.12. Below that are the February and January higher lows around $52.
The buy zone is therefore between last week’s low of $56 and the January low of $51.61. This is an area where bulls will begin to buy and bears will begin to take profits.
What will bottom look like?
The bulls have to stop the selling before they can get a two- to three-week rally. There is no sign of a bottom yet.
However, the selling should slow over the next few weeks. Traders will look for a good buy signal bar, especially if there is a micro double bottom. They will then begin to buy, expecting a rally up to resistance.
The first target is the top of the most recent sell climax, which his Wednesday’s high of $59.70. That is about $60. That usually corresponds to the 20-day exponential moving average.
Trading Room
Traders can see the end of the day bar-by-bar price action report by signing up for free at BrooksPriceAction.com. I talk about the detailed E-mini price action real-time throughout the day in the BrooksPriceAction.com trading room. We offer a two-day free trial.


