

The equity market weakness following the yield curve inversion is compounded by the fact that the Russell 2000 continue to exhibit weak technicals, reports Bonnie Gortler.
With uncertainty about the economy, the Federal Reserve cut interest rates for the first time since 2008 on July 31. The news triggered selling by investors and increased volatility in August as the market was looking for either a larger cut or a commitment to further rate cuts, but Fed Chair Jay Powell refer to the move as a mid-cycle adjustment.
The S&P 500 average daily change for the past 25 days is 0.88% and the Nasdaq Composite average daily change is 1.07%. Unfortunately, the technical picture is not as favorable as earlier in the year. The Cumulative Daily Advance-Decline Line of the New York Stock Exchange Index (NYSE) peaked on July 30. Since then market breadth has been negative. This month exhibited broad-based stock price weakness with three consecutive weeks of more than 1800 net declining issues on the New York Stock Exchange Index (NYSE). This is not the type of tape action you normally experience to sustain a meaningful advance.
Defensive sector exchange traded funds such as the iShares US Real Estate ETF (IYR), Consumer Staples Select Sector SPDR Fund (XLP) and the Utilities sector Select Sector SPDR Fund (XLU) continue to perform well. If the market were to begin a major decline, I would expect these sectors to hold up better than the broad market but not be unharmed. Most times when a market correction occurs, the decline will not end until the best performing sectors fall too.
At present, these defensive sectors are strong, trading at new highs. Even though the major averages are not far from their new highs it remains worrisome that many sectors have not made new all-time highs. This raises a red flag with regard to the overall health of the market and how much longer it will continue moving higher before a significant decline begins.
Broad-based index ETF’s such as the iShares Russell 2000 ETF (IWM) and the SPDR S&P MidCap 400 ETF (MDY) are still underperforming the SPDR S&P 500 ETF Trust (SPY) substantially below their all-time highs. As of the Aug. 20 close, the IWM) and MDY are -14% and -8.5% below their August 2018 highs respectively. Other ETFs below their all-time highs are the Dow Jones Transportation ETF (IYT), -14.1% and the Emerging Markets ETF, -23.6%. If these sectors and the emerging markets continue to underperform, I would expect the market to remain volatile and be vulnerable to a potential serious market decline.
Where do we go from here?
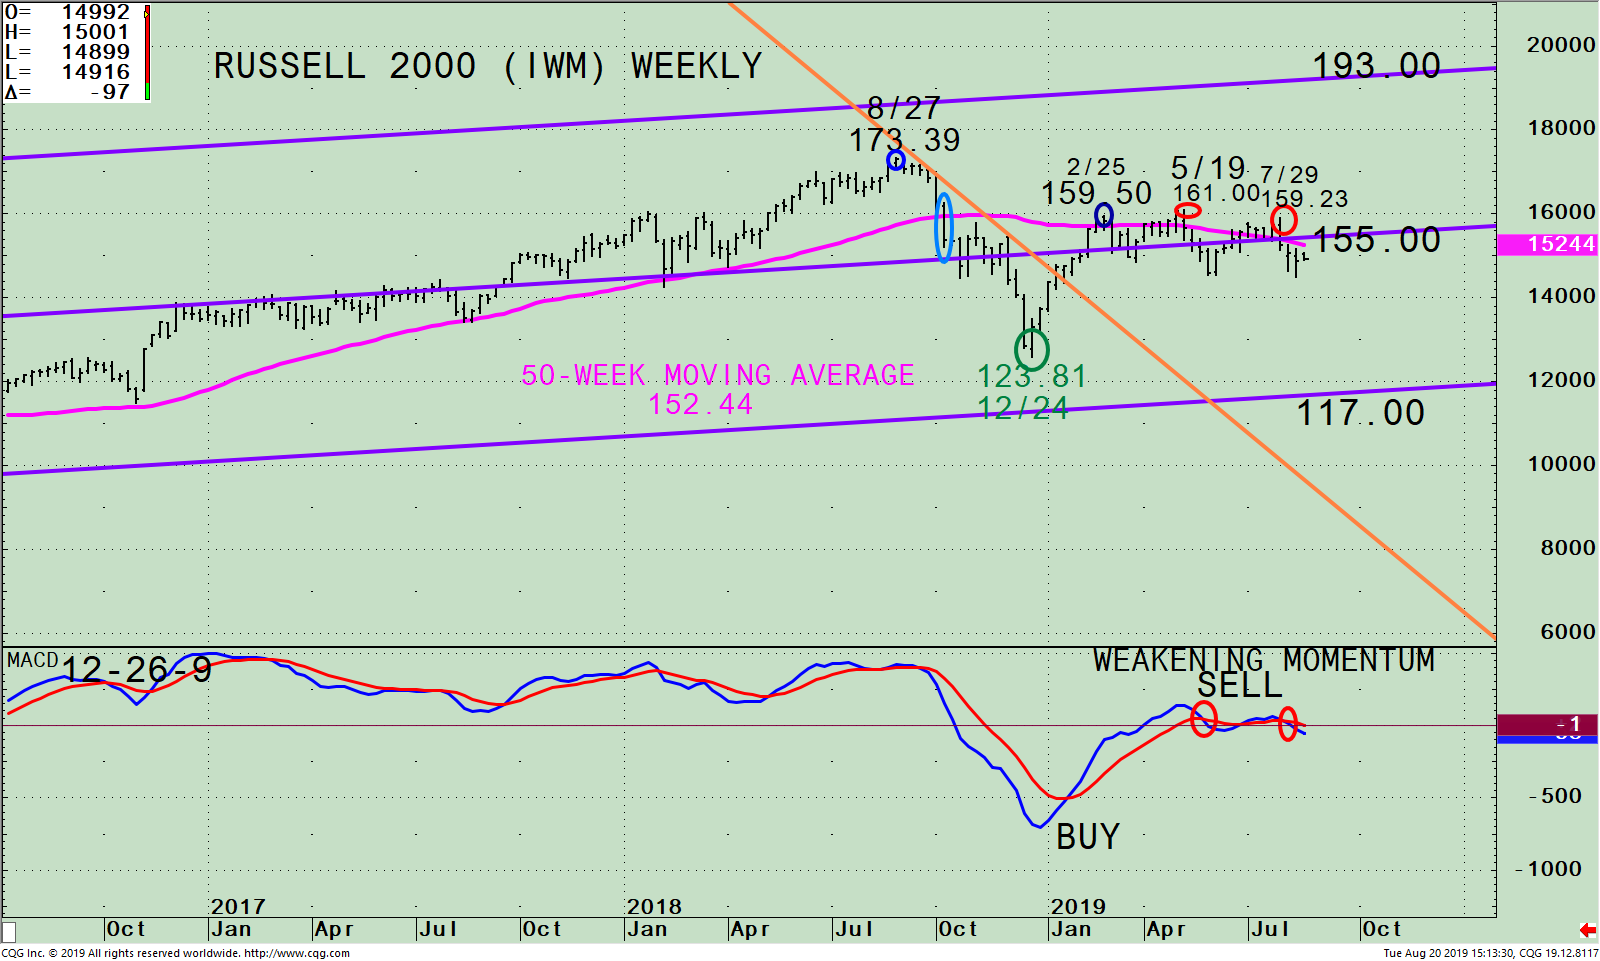
Figure: Weekly Russell 2000 (IWM) Price (Top) and 12-26-9 MACD (Bottom)
The top portion of the IWM chart shows a weekly chart and its active price channel (purple line) with a 50-week moving average (pink line) that traders watch and use to define trends.
The Russell 2000 has not confirmed the new all-time high made in the S&P 500 in July 2019. It began to weaken in October 2018 after falling below the 50-week moving average at 159.00 (blue circle). Selling accelerated after it fell below the middle channel making a low at 123.81 on Dec. 24. In January 2019, the IWM rose sharply as other indices, breaking the downtrend (orange line), then stalled on Feb. 25 at 159.50 after slightly penetrating the 50-week moving average. This pattern continued. On May 19 IWM slightly penetrated the 50-week moving after reaching 161.00 (first red circle) and turned down.
On July 29, for the third time, IWM made a lower high at 159.23 (red circle on right) and then turned down away from its 50-week moving average.
The chart indicates signs of weakening momentum with the slope of the 50-week moving average declining. Its price is well below the 50-week at 149.16. Until IWM shows strength and has a weekly close above the 50-week moving average at 152.44, it remains bearish. If IWM closes below the Aug. 12 low at 144.79 it’s likely selling will intensify, and a test of the December lows could occur.
The lower portion of the chart is the MACD, a technical indicator that measures momentum. MACD is on a sell, falling below 0 with a bearish negative double top formation. For now, MACD remains a sell for IWM and no signs yet imply that the downside momentum is complete.
Our intermediate-term U.S. equity timing model remains on its Aug. 2 sell signal. The Russell 2000 continues to underperform the S&P 500, and its trading below its 50-week moving average. The weekly MACD is on a sell with a double top showing a clear pattern of weakening momentum suggesting the short-term could be vulnerable. The first clue of more favorable market action would be if the IWM begins to outperform the S&P 500 (SPY) for several consecutive weeks. It would be a positive sign if and when IWM has a weekly close above the 50-week MA (152.44). However, to believe the IWM will not stall as it has, it needs to close above 161.00, the May high, clearly penetrating the 50-week Moving Average. On the other hand, a close below the August 12 low of 144.79 would suggest the stock market may begin a more serious decline.
Contact me at: bgortler@signalert.com to share your thoughts or ask me any questions you might have.
Sign up here for a free three-month subscription to Dr. Marvin Appel’s Systems and Forecasts newsletter, published every other week with hotline access to the most current commentary. No further obligation.


