

“Whenever you find it easy to do something, [its likely because] institutions are eager to do the opposite,” writes Al Brooks.
Bitcoin has a minor bottom and should fall below $7,500 within a month.
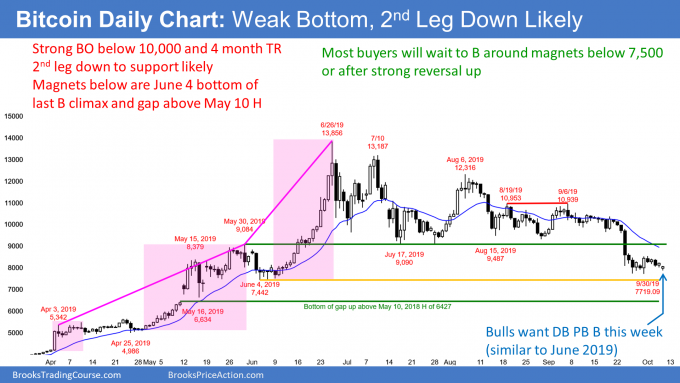
The Bitcoin cash index daily chart collapsed below $10,000 two weeks ago (see chart below). I wrote on Aug. 24 that $10,000 was fake support and that Bitcoin would probably have to test $7,500 before strong buyers would look to get back in. It was way too easy to buy with limit orders at $10,000 for three months.
Traders should always assume that an institution is taking the other side of every trade. Why? Because they are 95% of the volume in most markets. That is not yet true in Bitcoin, but it is true enough.
Whenever you find it easy to do something, [its likely because] institutions are eager to do the opposite. The result is that you will typically lose money. “Good fill, bad trade.” This is a good example.
$ 10,000 Ledge
Whenever a market hits a price four or more times in a trading range, that price is a ledge. When there is a ledge on the daily or weekly charts, there is a high probability of two things: A chance of a break beyond the ledge or a pullback through the ledge breakout point. That pullback usually comes within 10 to 20 bars, but it can come sooner or much later.
There was a ledge bottom at $10,000, which was psychological support. That is now resistance, but resistance is a magnet. Traders should expect at least a small test above $10,000. It will probably come within a couple months, but it might take many months.
Once the market gets back above $10,000, traders will then decide if there will be a continued bear trend or a resumption of the 2019 rally. If there is a rally, traders will see the break below $10,000 as a bear trap in a bull trend.
Whenever there is a reversal from a buy climax (like in June), traders expect a test of the bottom of the most recent leg up. That began with the June 4 low of $7,442 and that is why I said that Bitcoin was going to fall below $7,500. This is despite the pundits claiming that the four sideways months was forming a base that would lead to $20,000, $50,000 or even $1 million.
Additionally, I said that the selloff might close the gap above the May 10 high. Also, the bulls might wait for it to test the April 25 low, which is the bottom of the second leg up in the parabolic wedge rally. The gap above the May 10 high of $6,427 is another magnet within reach.
Reversals from wedges often go to the start of the wedge, which is the December low of $3,135. While possible, that would indicate that the bull trend is over. Unless it falls there, the selloff is still more likely a pullback from the 2018 rally. Therefore, there will probably be at least one more rally to above $10,000 within three to six months.
The bulls want the rally to be the resumption of the bull trend. However, that rally would be almost as likely to be a bull leg in a trading range that could last for years.
The bears want the June rally to be a lower high in a bear trend. They therefore want a selloff to below the bottom of the bull trend. That is the Dec. 14, 2018 low of $3,135. If the bears achieve their goal, then Bitcoin will probably be in a trading range between $3,000 and $10,000 (with a chance spike to $14,00) for several years.
Trading Room
Traders can see the end of the day bar-by-bar price action report by signing up for free at BrooksPriceAction.com. I talk about the detailed E-mini price action real-time throughout the day in the BrooksPriceAction.com trading room. We offer a two-day free trial.


