

A parabolic wedge buy climax sell signal was triggered in the 30-year bond last week.
The 30-year U.S. Treasury bond futures market triggered a parabolic wedge buy climax sell signal on the monthly chart in November. It will probably go sideways for several months.
The long bond futures broke below the October low in November on the monthly chart. This means that the breakout above the August high might be failing (see chart).
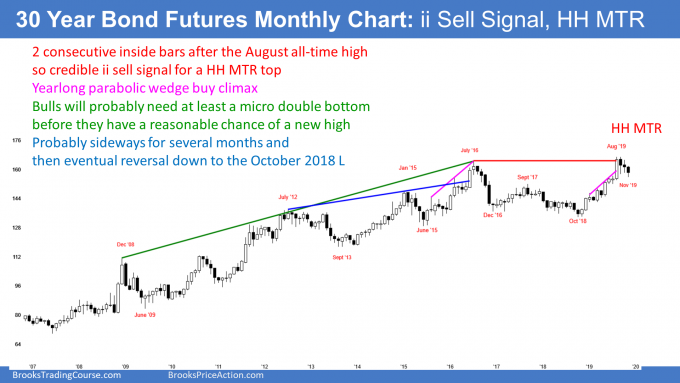
August was a big bull trend bar and it broke above a 10-year nested wedge top. September did not confirm the breakout. Instead it was a big bear bar and an inside bar. An inside bar means that its high was below the August high and its low was above the August low.
October was then inside of September. Consecutive inside bars (II Breakout) is a breakout mode pattern. Climaxes often reverse when there is an II Breakout Mode pattern.
November broke below the October low and that triggered the sell signal. November is therefore the entry bar. But instead of a big bear bar closing on its low, it is currently trading up in the middle of its range. Furthermore, it is back at the October low. This is not a strong bear trend reversal.
Problems with the II top
There are two additional problems with this reversal down. First, both inside bars had prominent tails and did not close near their lows. This is a sign of hesitation. It represents uncertainty. Uncertainty typically results in several sideways bar, giving traders time to make up their minds about the direction of the next move.
The second problem is that the 2019 parabolic wedge buy climax was in a tight bull channel. That rarely quickly reverses into a bear trend. Much more often, the chart goes sideways for five to 10 bars before the next leg up or down begins.
Both of these factors make a trading range likely for five to 10 months. Is November the bottom of the range? Ten bars is a long time. November will probably not be the bottom.
Possible Final Bull Flag
What happens if there is a trading range? It is in a bull trend, and a bull breakout usually is more likely.
But the context weakens that argument. Here, a nested wedge has been forming for 10 years. August is a breakout above that wedge. So far, the breakout is failing.
Since a nested wedge top is an unusually reliable pattern, traders should expect a reversal down. The consecutive inside bars after the August failed breakout is a good candidate for the start of the reversal down from the high.
But if the monthly chart goes sideways for a year, the bulls might get one more brief new high. It will probably fail and the trading range would then be the Final Bull Flag. Traders should still expect a 20-year bear trend in bonds.
I have said many times that a 30-year bull trend might take years to reverse. Nothing has changed. Traders should conclude that either August will be the top or that there will be one more brief new high for the final top. Americans will not allow interest rates to fall to zero, which means that bonds should not go much higher.
November might become a High 1 bull flag
If November closes near its high, it will be a High 1 bull flag buy signal bar. If December goes above the November high, it would trigger the buy signal.
But a reversal down after a buy climax usually has a second leg sideways to down. Consequently, a rally above the November high would probably only last a month or two. Traders will sell above the November and August highs, betting against another strong leg up.
They believe that the strong bull trend is evolving into a trading range. They will sell rallies, like above the November or August highs. They will also buy selloffs, like below the October low.
Trading Room
Traders can see the end of the day bar-by-bar price action report by signing up for free at BrooksPriceAction.com. I talk about the detailed E-mini price action real-time throughout the day in the BrooksPriceAction.com trading room. We offer a two-day free trial.


