

While the long bond is entering a bear phase, it’s a long turnaround, notes Al Brooks.
The U.S. Treasury bond market is in an early bear trend on the monthly chart, but it is at support. The nested wedge bottom on the daily chart could lead to a bounce for a week or two.
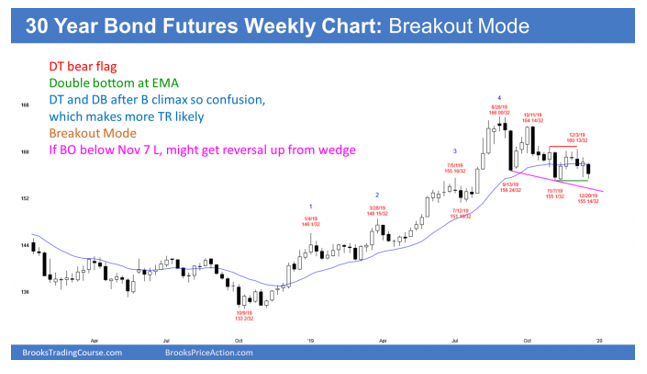
The 30-year Treasury bond futures is having a third push down since the August top on the weekly chart (see below). The bulls want either a double bottom with the Nov. 7 low or a failed breakout below that low. A reversal up from below would be a wedge bull flag where Sept. 13 was the first leg down.
If the bulls get a reversal up, it will probably be minor. The monthly chart (not shown) has been creating a major top over the past several years. Even if the bulls get a new all-time high, it will probably be brief. Traders should expect the bonds to work lower over the next decade.
That means interest rates will start to go up. I have said many times that the American public will not allow zero interest rates. They would see that as an unacceptable failure.
Americans are proud and see themselves as the world leaders in capitalism. If their country cannot afford to pay interest on the money it borrows, and in fact charges money to people lending it money (people who buy bonds), that would be offensive. It therefore will not happen. That is a fundamental reason why the bonds will not rally much from here. The technical picture of a nested wedge on the monthly chart is a strong reason as well.
Where do bonds go from here?
The monthly chart is creating its fourth consecutive doji bar. This is coming after a parabolic wedge top and a failed breakout above a nested wedge top. Bonds will go lower on the monthly chart.
When there is a reversal down from a buy climax, the first targets are the 20-month exponential moving average and the bottom of the most recent buy climax. That is the August low on the monthly chart. Traders should therefore look for lower prices over the next several months. This is true even if there is a bounce early in 2020.
After three or four bear bars down from a buy climax, traders expect at least a small second leg down. Consequently, any rally over the next several months should be minor. It could last one to three bars. Since this is a monthly chart, that means a few months. But it will form a lower high and lead to at least a small second leg down.
It is important to note that a second leg down means that the 1st leg down will end at some point. There will soon be a bounce. Furthermore, 5 or 6 consecutive bear bars would be unusual. Traders should expect a bull bar in January or February.
Wedge bottom on daily and weekly charts
The December selloff on the daily chart (not shown) has three legs down. Thursday and Friday formed small bull reversal bars. Traders see this as a wedge bottom and a double bottom with the November low. They therefore expect a couple legs up within a few weeks. It might begin next week.
The wedge selloff on the daily chart is the third leg down in a possible wedge bottom on the weekly chart. Therefore, the daily wedge is nested within a bigger weekly wedge. A nested wedge bottom has a higher probability of leading to a rally with at least a couple legs up.
The bulls might even get a rally to the 166 top of the two-month trading range over the next couple months. However, the odds still favor any rally to form a lower high. Traders should assume that the bond market will work lower for many years. There will be many strong rallies, but each will be followed by a new low in the developing bear trend on the monthly chart.
Trading Room
Traders can see the end of the day bar-by-bar price action report by signing up for free at BrooksPriceAction.com. I talk about the detailed E-mini price action real-time throughout the day in the BrooksPriceAction.com trading room. We offer a two-day free trial.


