

While there may be a correction to play, precious metals still look strong, according to Avi Gilburt.
I want to be bullish the metals at this time based upon the larger degree structure, especially in silver. However, I must also outline the microstructures, and simply do not have clear micro-structure in gold. Whereas silver has certainly provided us with the minimum number of waves to consider its wave [2] as completed, and VanEck Vectors Gold Miners ETF (GDX) has nearly reached the minimum target I wanted to see, the SPDR Gold Shares ETF (GLD) has not even come close to providing us with a clear and clean second wave pullback.
But, despite apprehension over the micro-structure, traders cannot ignore the larger degree structures. In fact, experience teaches that when the bull market in metals takes hold, pullbacks are often shallow. This is what causes the “chasing” of price we often see in metals in 3rd waves, and especially in 5th waves.
With silver providing us with all of the wave [2] pullback we may see, and now about to complete 5 waves up (needing a micro spike higher to complete the 5th of 5th in wave i), I have gone on high alert for a bullish break out.
Once this wave i in silver completes, and the market provides us with a wave ii corrective pullback, the breakout over the high of wave i is the breakout with a continuation over the 19-region pointing us to $21.70 and probably quickly. This will likely be a very strong bullish indication for precious metals.
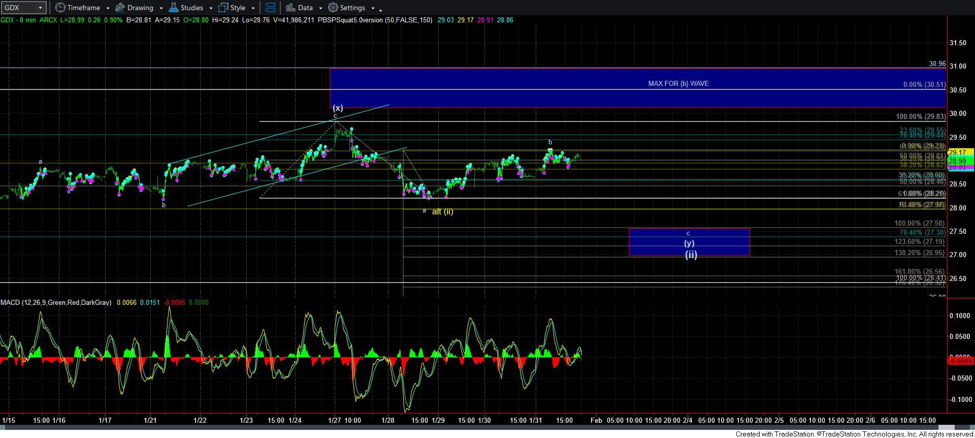
Watch resistance at $29.20 in the GDX. That level was tested many times in late January. The rally from $28.20 as a b-wave in a w-x-y wave [ii] structure. That would suggest we can still see a c-wave lower to complete this wave [ii] pullback into a target from $27 to $27.60. But, a direct breakout over the resistance would force me to turn bullish sooner rather than later (see chart below).
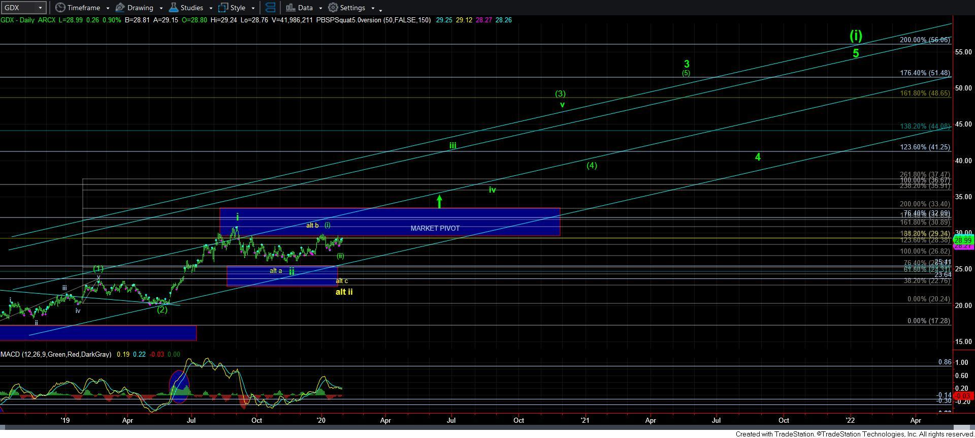
In the larger degree structure outline on the daily GDX chart (below) should we see a breakout over the market pivot, then long term stops should be placed at the bottom of the pivot. For once we break out over that resistance, a break back down below it could signal the more bearish case scenario we have discussed in the past.
As far as the GLD, look for a c-wave down to complete this 2nd wave structure. However, if we see continued strength in this chart too, which takes us through the b-wave resistance, assume wave 2 is done with the small pullback which has already been seen (see chart below).
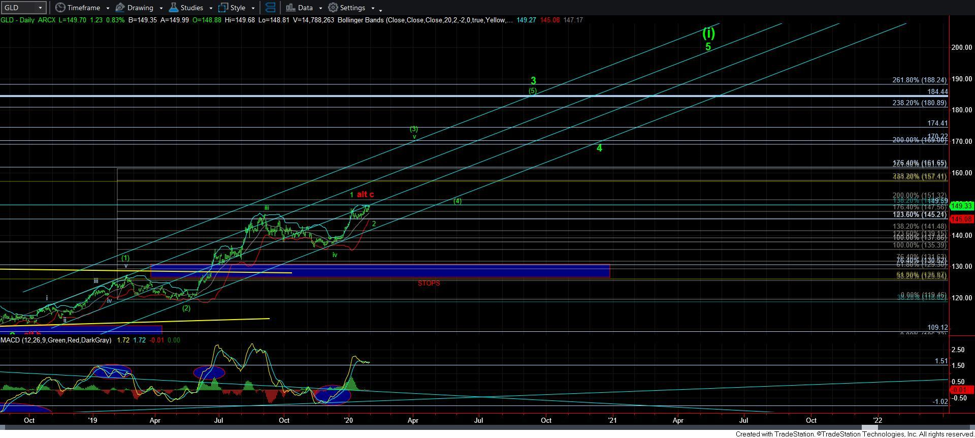
In fact, if we are going to see more weakness in the metals complex, GLD may outperform to the downside to “catch-up” in its pullback structure. But, minimally, I still would prefer to see the 144 region for a [c] wave of wave 2.
While it is certainly possible that the metals market resolves in a bearish fashion, there is nothing on the chart which supports this. The market is maintaining a strong bullish structure, and all support levels have been respected. Until we see some evidence of a bearish potential, there is nothing yet to be concerned about. Should we see more evidence of a potential bearish resolution of this rally, I will certainly provide notification to our membership.
Originally published on Sat Feb. 1 for members of ElliottWaveTrader.net:
Avi Gilburt is a widely followed Elliott Wave analyst and founder of ElliottWaveTrader.net, a live trading room featuring his analysis on the S&P 500, precious metals, oil & USD, plus a team of analysts covering a range of other markets.


