

The EURUSD currency pair has had many big legs up and down in recent weeks, which will likely continue, reports Al Brooks.
The EURUSD currency pair has had many abrupt reversals over the past six weeks on its weekly chart (see below). Traders are deciding if the two-year bear trend will continue to below the January 2017 start of the bull trend. If it does, traders will then expect a test of par.
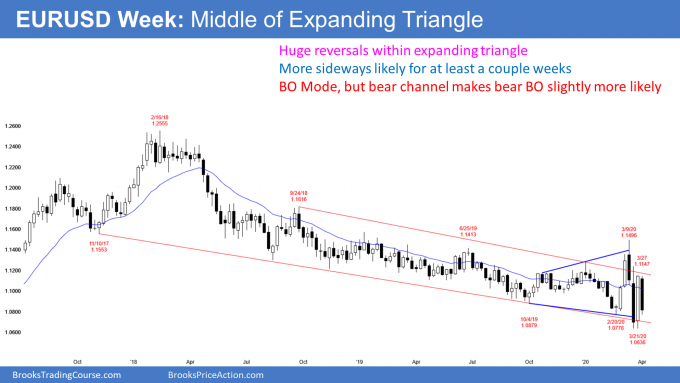
The alternative is a reversal up from the two-year bear trend. The bulls want a successful breakout above the 20-month bear channel and a rally back to the start of the channel. That is the September 2019 high, which was the top of the first strong bounce after the sharp bear breakout in April 2017.
Which is more likely? You tell me. When the market is repeatedly reversing and the reversals are abrupt and big, neither the bulls nor the bears can maintain control. They both take quick profits because they believe that another reversal is more likely than a successful breakout of the eight-month trading range.
Because the trading range is in a two-year bear trend, there is always going to be a slightly higher probability of a bear breakout. But the EURUSD would not be going sideways if the bears had a significant advantage. It would be selling off relentlessly.
Markets have inertia. There is a strong tendency for a trend to continue. But there is also a strong tendency for a trading range to continue as well. As a result, no matter how strong the legs up and down have been over the past couple months, each has reverse.
March was a huge doji on the monthly chart
The monthly candlestick the euro in March was huge. It broke above and then below the 20-month bear channel. It then closed almost exactly where it opened, which was the middle of the eight-month tight trading range.
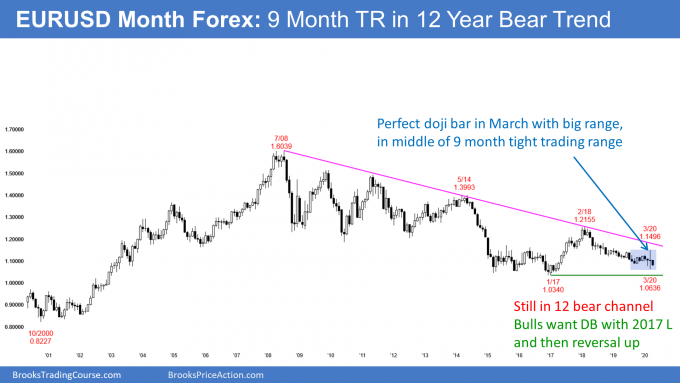
That big doji bar in March is a sign that the EURUSD is intensely neutral. Consequently, April will probably be sideways as well. Since April opened in the middle of March’s huge range, April will probably not break out of that range. It would then be an inside bar after an outside bar.
Since the bar before an outside bar is within the range of the outside bar, the sequence is inside-outside-inside (ioi). This is an ioi pattern. That means the market is perfectly balanced and in breakout mode.
When the market is in breakout mode, there is a 50% chance of a successful bull breakout and a 50% chance of a successful bear breakout. Furthermore, there is a 50% chance that the first breakout will reverse.
Even if April goes beyond the March range, it will probably not get far above or below. It has opened in the middle of the March range. Therefore, if it breaks out, it will mostly overlap March. That would be a continuation of the eight-month range.
Traders expect more sideways trading next week
What should traders expect this week? The same as they have for months. If the EURUSD goes down, they will look for it to reverse up. If it goes up, they expect it to reverse down. Until there is a breakout, there is no breakout. Traders will continue to bet on reversals until there is clear breakout.
Trading Room
Traders can see the end of the day bar-by-bar price action report by signing up for free at BrooksPriceAction.com. I talk about the detailed E-mini price action real-time throughout the day in the BrooksPriceAction.com trading room. We offer a two-day free trial.


