

Is the endless bull bond trend finally over, asks Al Brooks.
The U.S. 30-year Treasury bond futures had a blow-off top in March. They will probably be sideways to down for the rest of the year.
The 30-year bond so far this month is forming a small bar in the middle of last month’s range. The first three months of this year formed the three biggest consecutive bull trend bars in the entire bull trend (see monthly chart below). When the strongest breakout comes late in a bull trend, there is a 60% chance that it is at least a temporary end of the trend.
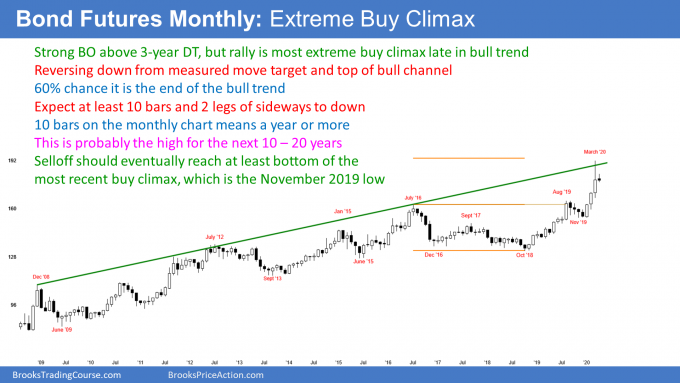
This buy climax reversed down from a measured move based on a four-year trading range. It also reversed down from a failed breakout above top of the bull channel.
This is an example of a blow-off top. That is an extreme buy climax late in a bull trend at significant resistance. It typically will attract profit taking. Bears will also sell. The result will probably be at least a pause in the bull trend. More likely, it will lead to a protracted trading range and eventually a bear trend.
When a trend ends, it sometimes reverses into an opposite trend. But more often, it transitions into a trading range. The range typically has at least a couple legs sideways to down and lasts at least 10 bars. Since this is a monthly chart, that is about a year.
After that, the chart would be in Breakout Mode. Theoretically, there would be an equal chance of a bull or bear breakout. If there is a bull breakout, the trading range would probably be the Final Bull Flag. That means the breakout would likely fail. Traders would expect a reversal into a bear trend that could last a decade.
What happens if there is a bear breakout?
If instead there is a bear breakout below the upcoming trading range, there is a 50% chance that it would lead to a bear trend. There is also a 50% chance that it would reverse up and just increase the height of the trading range.
The first reversal down from a climactic reversal usually retraces to the bottom of the most recent buy climax. That is the January low at around 154.
However, trends in the bond market typically last for two to three decades. Consequently, the bond market will probably work lower for at least 10 years. This is true even though it has not yet begun to trend down. The transition from a bull trend to a bear trend can take many years.
Trading Room
Traders can see the end of the day bar-by-bar price action report by signing up for free at BrooksPriceAction.com. I talk about the detailed E-mini price action real-time throughout the day in the BrooksPriceAction.com trading room. We offer a two-day free trial.


