

U.S. economic data disappoints, look at fx/S&P correlations for directions, notes Joe Perry.
When U.S. traders woke up Wednesday, S&P 500 futures were already down 35 handles. Whatever the reason, whether it was a blame game about the Coronavirus or expectations of disappointing U.S. data, the markets were in risk off mode. When the U.S. data was released, it wasn’t the reading economists were looking for. Below is the important U.S. data released Wednesday, along with their expectations, last reading, and whether the data was better or worse:
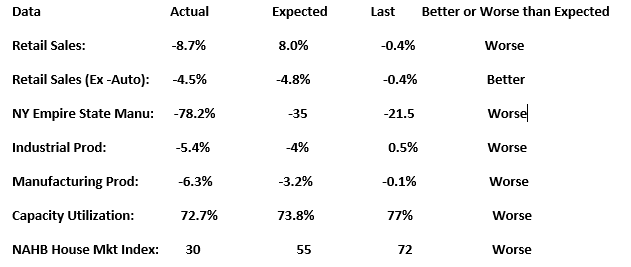
Two things jump out from this data picture:
1) Retail sales data and the NY Empire State Manufacturing Index were THE WORST ON RECORD
2) Most of the data was much worse than the survey of economists had expected. This comes on the heels of the three worst weeks of initial jobless claims data ever, totaling nearly 17,000,000. And expectations for Today’s initial claims data is for another -5,000,000.
However, one thing we know about markets is that they are always trying to price in future data. So, traders will look at this data in one of two ways, both of which depend on the outlook of the Coronavirus:
1) Ignore the data, its old and we are past the peak of the Coronavirus, so buy risk (we shut down the economy, only data from after we reopen it is relevant).
2) this data is horrible, even worse than economists thought, and there is more to come because the Coronavirus has not yet peaked. No one knows when the United States will re-open, therefore sell risk.
So far Wednesday, it appears as though stock prices don’t believe the worst is over yet and the latest rally was just a bear market rally. The S&P 500 traded up to near 2850 and stalled as price is currently forming a marubozo black candle (see chart below). This candle formation has little or no upper and lower wicks, which means the opening price is the same as the high and the closing price is the same as the low. This is a very bearish formation.
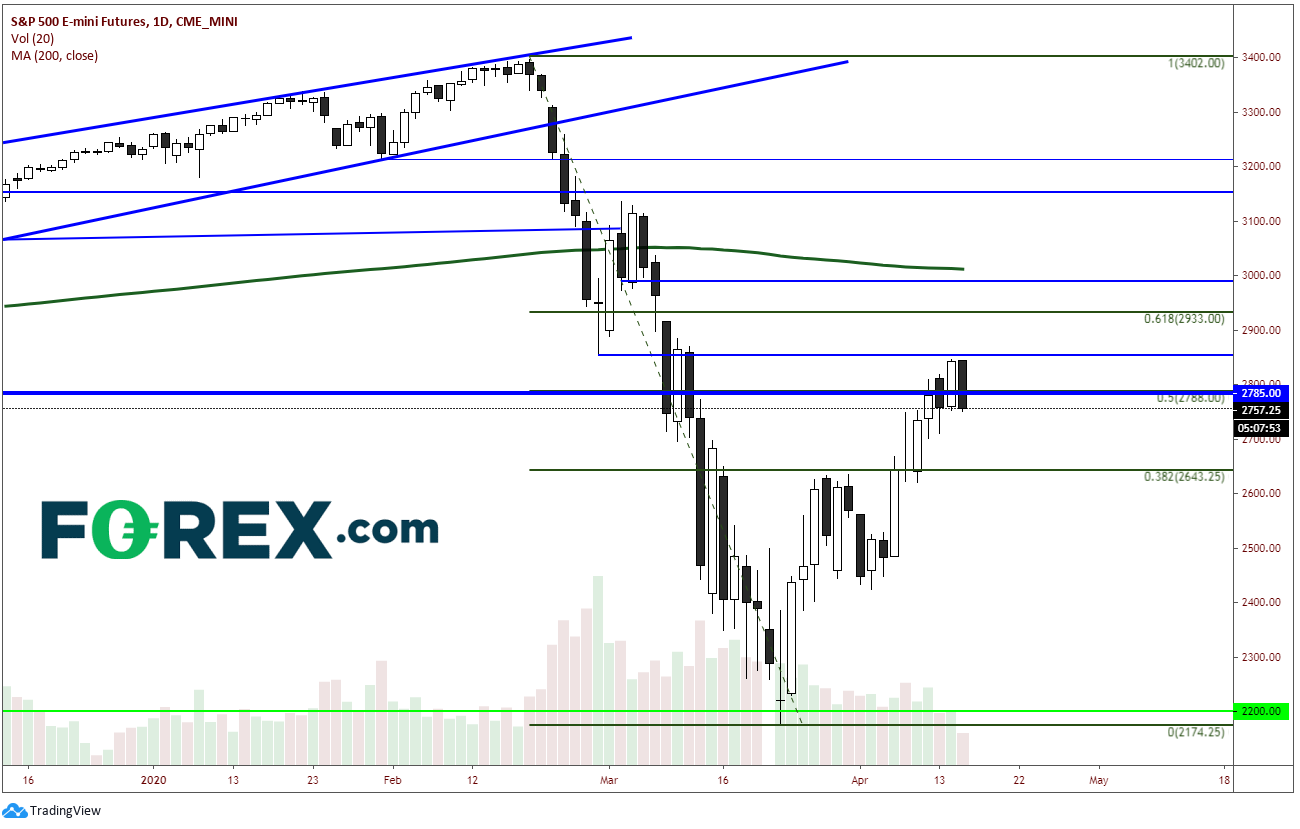
Source: Tradingview, CME, Forex.com
Traders will need to continue to watch the daily Coronavirus briefings and the weekly initial jobless claims data to determine where we are along the Coronavirus path.
Strange Stock/Forex Correlations
After putting in a low on March 23, the S&P 500 has been moving aggressively higher, only pausing at the 38.2% Fibonacci retracement level from the Feb. 20 high to the March 23 low. It broke out of a pennant formation on the move higher which targeted near 2900/2925, near horizontal resistance and the 61.8% Fibonacci retracement level of the previously mentioned timeframe. Wednesday, price halted at minor horizontal resistance and moved lower to test yesterday’s daily low and put in an ominous, dark candlestick (see chart).
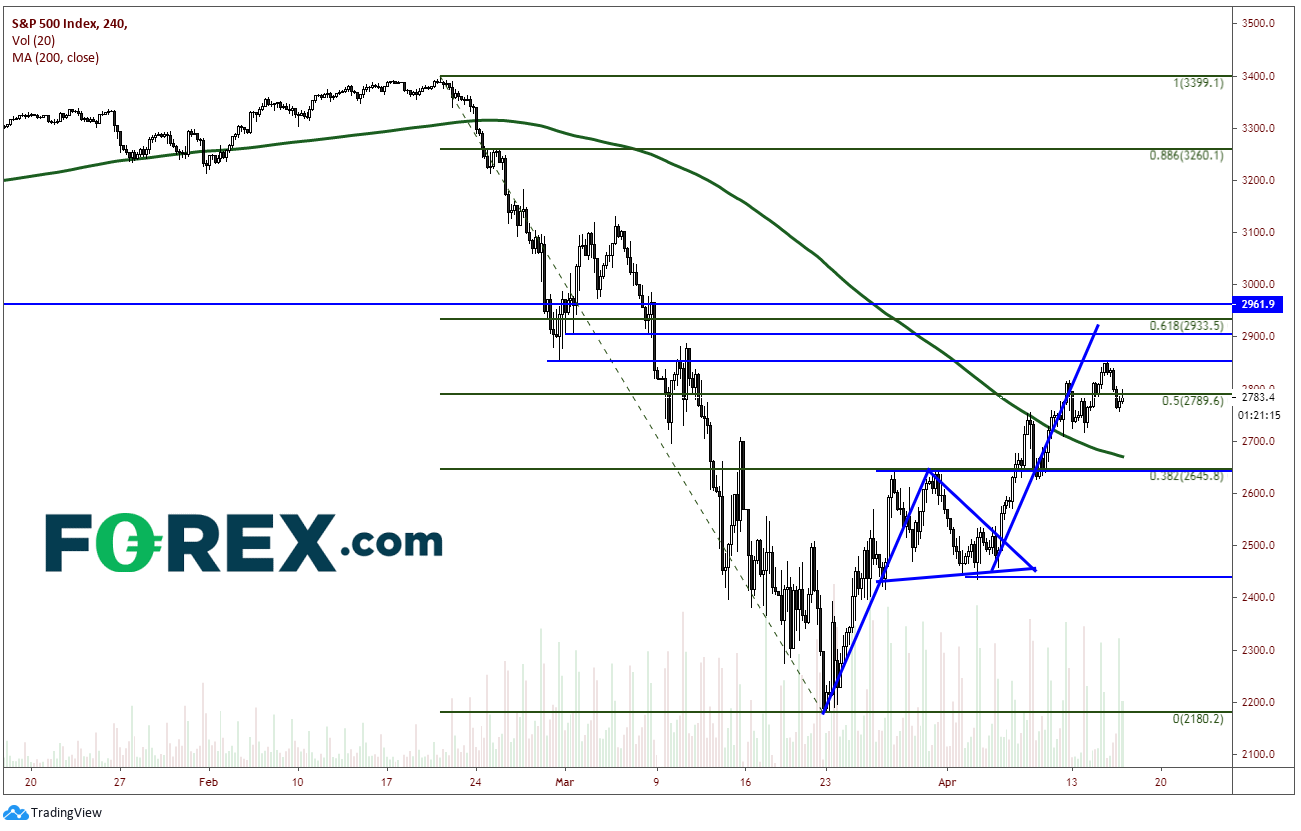
Source: Tradingview, CME, FOREX.com
So, the question to ask now is: Why did stocks stop moving higher here? Was it the minor horizontal resistance? Was it the expectations of weaker data (the move started overnight)? Was it more bad Coronavirus news? Sometimes we don’t know, and that’s ok. But we should always be looking for clues as to why, so that when we see it again, we may already have an answer.
Let’s look at euro/Aussie dollar (EUR/AUD) pair. The currency pair is highly negatively correlated with the S&P 500. That is, when the EUR/AUD moves in one direction, the S&P 500 moves in the opposite direction. The current correlation coefficient is -0.92. With this context in mind, the price movement of the pair has formed a descending wedge and had broken higher Wednesday. The target of a descending wedge is a 100% retracement of the wedge, which is near 1.8000. Therefore, because of strong correlation, if EUR/AUD is breaking higher, the S&P 500 should be moving lower (see chart below).
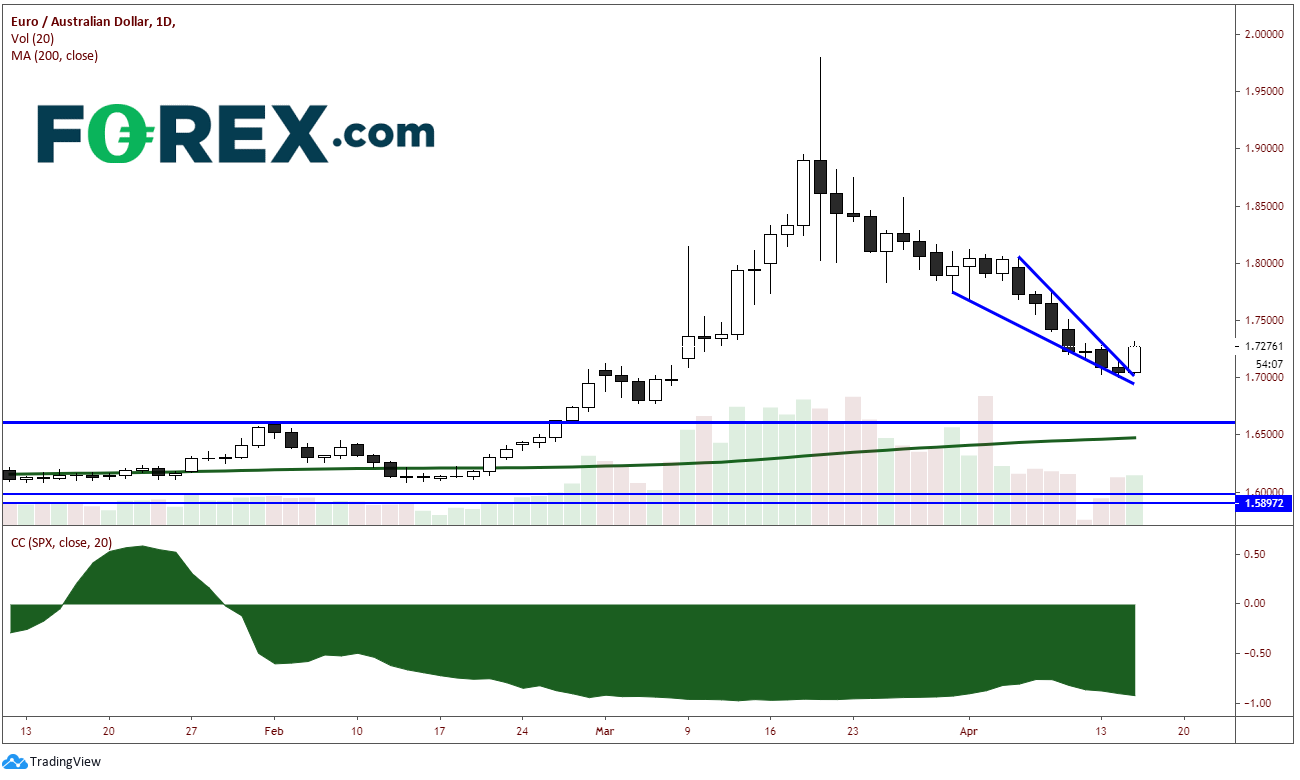
Source: Tradingview, FOREX.com
Now let’s look at euro/New Zealand dollar (EUR/NZD) pair. Similarly, EUR/NZD is also highly negatively correlation with the S&P 500. As with EUR/AUD, the correlation coefficient is also -0.92. In addition, the price movement of the EUR/NZD has also formed a descending wedge, with a target of 1.8475 at the 100% retracement of the falling wedge. One of the few differences between the price action of EUR/AUD and EUR/NZD is that EUR/NZD fell less than EUR/AUD from the March 19 high, and therefore, broke out of its descending wedge Tuesday instead of yesterday (see chart below).
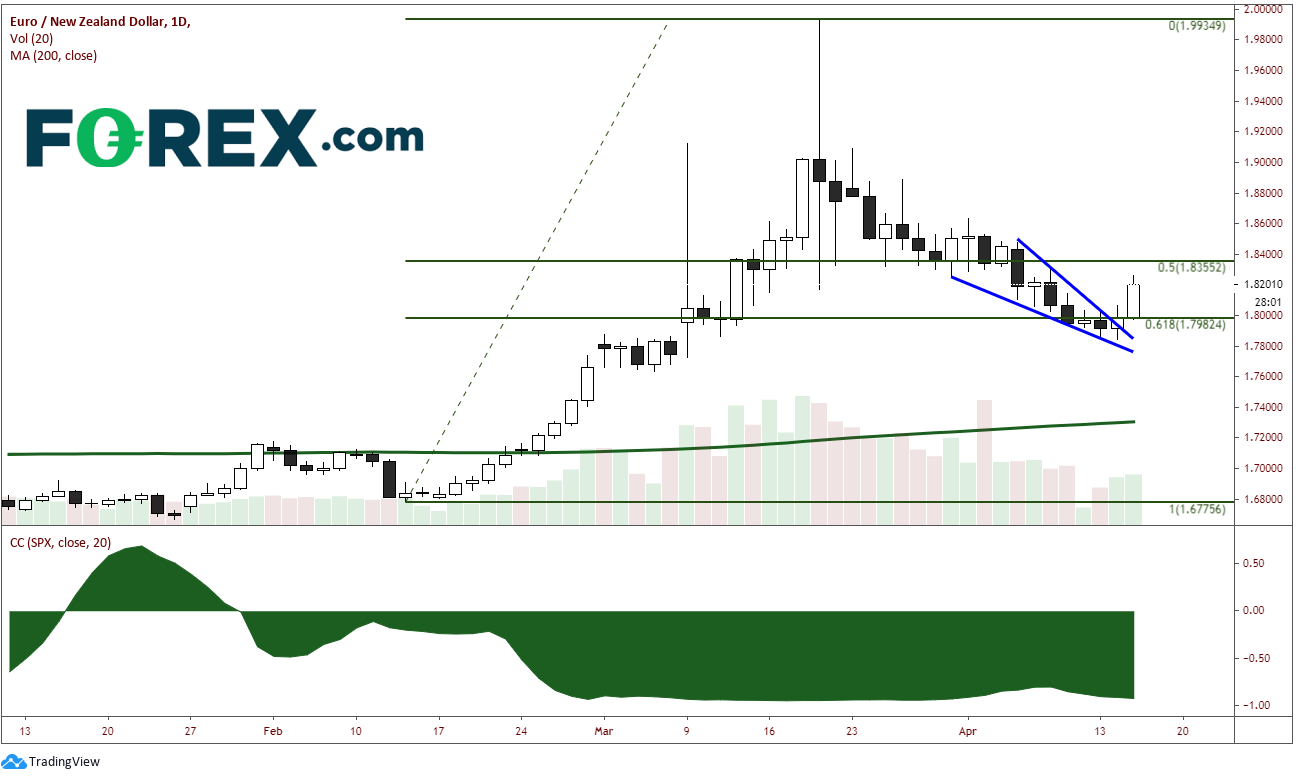
Source: Tradingview, FOREX.com
Wednesday, the S&P 500 closed down 2.35%, EUR/AUD closed up 1.33% and EUR/NZD closed up 1.22%. If you are looking for a reason that stock indices have turned, you can always look at the EUR/AUD and EUR/NZD to see what they are doing.
Joe Perry holds the Chartered Market Technician (CMT) designation and has 20 years of experience in the FX and commodities arenas. Perry uses a combination of technical, macro, and fundamental analysis to provide market insights. He traded spot market FX and commodity futures for 17 years at SAC Capital Advisors and Point 72 Asset Management. Don’t forget that you can now follow Forex.com’s research team on Twitter: FOREXcom and you can find more of FOREX.com’s research.


