

Long bond bulls take profits, but bull trend is still alive, reports Al Brooks.
U.S. 30-year bond futures are at the apex of a triangle on the daily chart. There probably will be a test of the November low within a few months. This is true even if the bonds break above the triangle and test the March high 1.
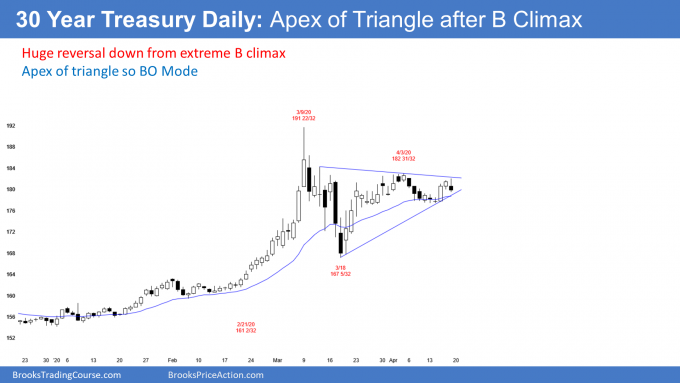
The 30-year Treasury bond futures daily chart has been in a tight range for the past four weeks. This follows the most extreme buy climax in history.
When there is an extreme buy climax, the bulls take profits. That does not mean that the bears take control, although there sometimes is an immediate trend reversal down. It is more common for the bull trend to pause. The more extreme the buy climax, the longer the pause. The bulls want to see if the bears are strong enough to reverse the trend. If not, the bulls will buy again.
This buy climax was present on the daily, weekly, and monthly charts. As a guide, traders expect at least two legs sideways to down over about 10 bars. Because there is a buy climax on the monthly chart, the sideways to down trading could last about a year.
Daily chart is in a triangle
The daily chart has been forming higher lows and lower highs since the March 9 high. It is therefore in a triangle.
A triangle is a Breakout Mode pattern. When a chart is in Breakout Mode, traders expect an eventual breakout to lead to a trend. But they know that the first breakout up or down fails 50% of the time.
It is important to understand that a chart cannot not be in a Breakout Mode pattern unless the probability of a successful bull breakout is the same as for a bear breakout. Think about this. If there was a 60% chance of a bull breakout, traders would not wait for the breakout. Why wait and buy higher when you know that it is going up?
Does a bull breakout above the triangle on the daily chart mean that there will be a rally to a new high? No. There is plenty of room up to the March high for a successful bull breakout to get near the old high without going above it. If it rallies to near the old high, the rally will probably reverse down and then form a bear leg in the developing year-long trading range.
Monthly chart has a tiny inside doji bar in April
On the monthly bond chart, this month’s high is far below last month’s high (see below). Also, its low is far above last month’s low. April is an inside bar. Additionally, its range is tiny compared to March’s.
Furthermore, it is currently near the open of the month. That makes it a doji bar at the moment, which is neutral. Finally, it is almost exactly in the middle of March’s range. This month is therefore as neutral as it could be after an extremely strong three-month rally.
If this month remains an inside bar, it will be a Breakout Mode bar on the monthly chart in addition to the Breakout Mode pattern (a triangle) on the daily chart.
That means April will be both a buy signal bar and a sell signal bar for next month on the monthly chart. The bulls will see March as a High 1 bull flag buy signal bar in a strong bull trend. But the bears will see it as a sell signal bar for a reversal down from an extreme buy climax.
If the month closes near its high, a bull breakout will be more likely in May. The bears want it to close near its low. That would increase the chance of a bear breakout.
If it closes near the open, it will be a lower probability signal bar for both the bulls and bears. That would increase the chance of more buyers below its low and more sellers above its high.
Trading range for the rest of the year
Does it really matter how April looks once it closes in a couple weeks? Not really. The monthly chart is likely to be sideways to down for the next year. If it goes up for a couple months, it will then probably reverse down.
What happens if it begins to trade down? When there is a reversal down from a buy climax, the selling usually continues down to the bottom of the buy climax. That is the January low of around 154. But it could take a year to get there and it might go up a little first.
Also, if it gets there, the bulls will probably start to buy again. That would create at least a bounce for a few months.
Trading Room
Traders can see the end of the day bar-by-bar price action report by signing up for free at BrooksPriceAction.com. I talk about the detailed E-mini price action real-time throughout the day in the BrooksPriceAction.com trading room. We offer a two-day free trial.


