

The euro/U.S. dollar currency pair has swung in either direction over the last few weeks and appears ready to breakout on either side, reports Al Brooks.
The EURUSD currency pair chart is at the apex of a diamond pattern. It will probably break out withing a few weeks. There is a 50% chance of the breakout being up or down.
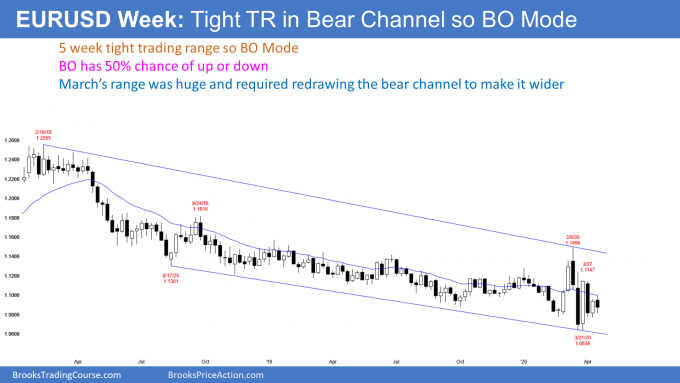
The EURUSD weekly chart has had dramatic reversals up and down over the past five weeks (see below). There was an expanding triangle and then a triangle (I did not draw the lines this week). That is a diamond pattern, which, like all trading ranges, is a Breakout Mode pattern.
Last week triggered a buy signal by going above the previous week’s high. That was a bull bar closing near its high. It formed a micro double bottom with the bar from three weeks earlier. Since this is taking place near the bottom of the three-month range, the EURUSD is more likely to trade up than down over the next few weeks.
However, last week was a bear bar. Not only is that a bad entry bar for the bulls who bought above the previous week’s high, last week is a sell signal bar for this week. The bears see last week as forming a Low 2 bear flag with the Low 1 bear flag from three weeks ago.
Whenever there is both a credible buy and sell signal, the market is in a trading range and in Breakout Mode. There is a 50% chance of a swing down and a 50% chance of a swing up. Furthermore, there is a 50% chance that the first breakout up or down will fail.
IOI Breakout Mode pattern
This month’s low is above last month’s low and this month’s high is below last month’s high (see monthly chart below). April is therefore inside last month’s range. It is an inside bar. That is a breakout Mode bar.

Furthermore, March’s high was above February’s high and March’s low was below. March is therefore outside of February, and February is inside of March’s range.
With April within March’s range, these three bars have formed an inside-outside-inside (IOI) pattern. That is a more significant Breakout Mode pattern than simply April being an inside bar. It increases the chance of a trend up or down following the breakout.
The bears see April as a sell signal bar for a Low 2 bear flag. But the bulls see it as a High 2 buy signal bar at the end of a two-year bear trend. If April ends up as a bear bar closing near its low, the odds of a bear breakout will go up. Conversely, if it is a bull bar closing near its high, the odds of a bull breakout in March go up. A small bull or bear body would increase the chance of another month or two of sideways trading.
Where will a breakout go?
Remember, the first breakout of a Breakout Mode pattern fails and reverses 50% of the time. This ioi pattern increases the chance of a breakout of the seven- to nine-month trading range and then a trend lasting for possibly a couple months.
If the bulls get their breakout, they will look for a rally to the September 2018 high. That is the start of the 20-month bear channel. A bear breakout will probably test the January 2017 bottom of the 2017 bull trend. It might continue down to par (1.00).
Trading Room
Traders can see the end of the day bar-by-bar price action report by signing up for free at BrooksPriceAction.com. I talk about the detailed E-mini price action real-time throughout the day in the BrooksPriceAction.com trading room. We offer a two-day free trial.


