

The euro is ready to reverse, again, says Al Brooks.
The EURUSD currency pair is near the bottom of a three-month trading range. It will probably begin to reverse up for two to three weeks within a couple weeks.
The EURUD has been in a bear channel for two years on its weekly chart (see below). Channels often spend a lot of time in trading ranges. The EURUSD had been sideways for eight months. It formed an expanding triangle into March and a contracting triangle over the past seven weeks. The triangle is easier to see on the daily chart.
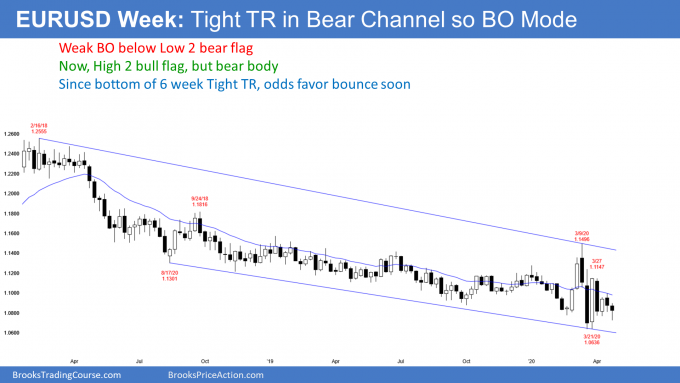
This is a diamond pattern. Diamond patterns and triangles are simply types of trading ranges. Every trading range is a Breakout Mode pattern. That means that the probability of a successful breakout is about the same for the bulls and for the bears. Furthermore, there is a 50% chance that the 1st breakout up or down will fail.
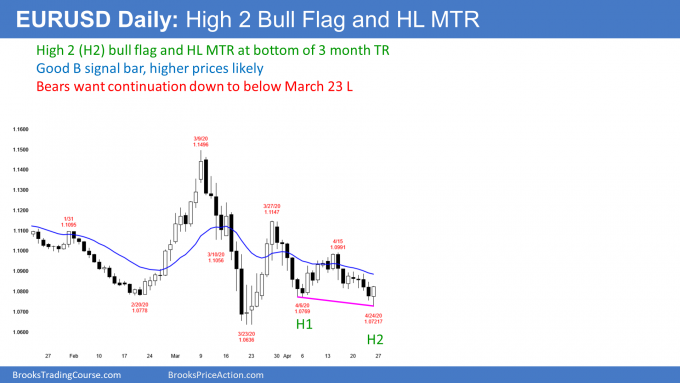
On the daily chart (below), the past two weeks have broken below the triangle. This corresponds to the breakout below the Low 2 bear flag on the weekly chart.
However, the breakout has been weak. Friday was a bull day and therefore a buy signal bar. The bulls see Friday as forming a higher low major trend reversal. In addition, it is the end of two legs down from the March 27 rally. There, it is also a buy signal bar for a big High 2 bull flag.
But the two week selloff has been in a tight bear channel. This is therefore a weaker buy setup. Most bulls will want at least a micro double bottom or a surprisingly big bull bar before concluding that a two- to three-week leg up is beginning. However, the odds favor higher prices beginning within 2 weeks.
Small sideways bar with prominent tails over the past two weeks is a sign of complacency. It reduces the chance of a big move up or down next week.
Will the bears get a test of par?
The bears want the breakout to continue down below the March low. If the bears get a couple consecutive closes below that low, traders will look for a break below the January 2017 low of 1.0340 and then a test of par (1.0).
But it is important to remember that there have been many breakouts and strong legs up and down for two years. Every one of them led to a reversal instead of a trend.
Traders therefore believe that this week’s breakout will not get far. They expect a reversal up from above the March 1.0636 low. And even if the selloff continues below that low, they know that there will probably be a reversal up.
Since the March low is nearby and a higher low is likely, traders expect a reversal up within the next few weeks. Less likely, there will be a successful break below the March low and a trend down to par.
Trading Room
Traders can see the end of the day bar-by-bar price action report by signing up for free at BrooksPriceAction.com. I talk about the detailed E-mini price action real-time throughout the day in the BrooksPriceAction.com trading room. We offer a two-day free trial.


