

Restaurant chart patterns by Suri Duddella.
The Coronavirus related strict shutdowns pushed many fast-food chains into deep bear markets except a few food delivery-based companies. Some of these stocks are trading in V-patterns and presents opportunities to trade them.
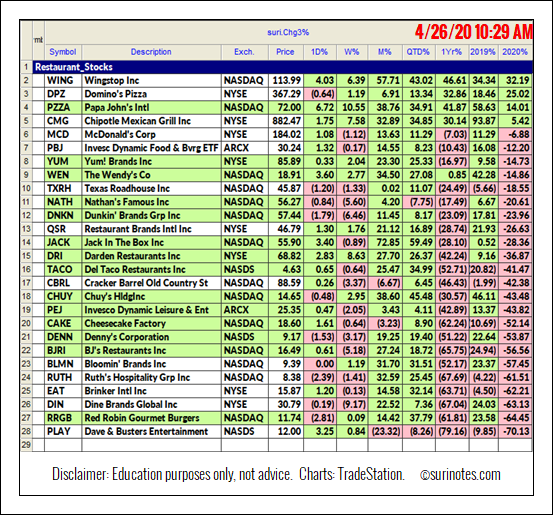
Here is a list of Fast Food Restaurants and their performances.
V Patterns
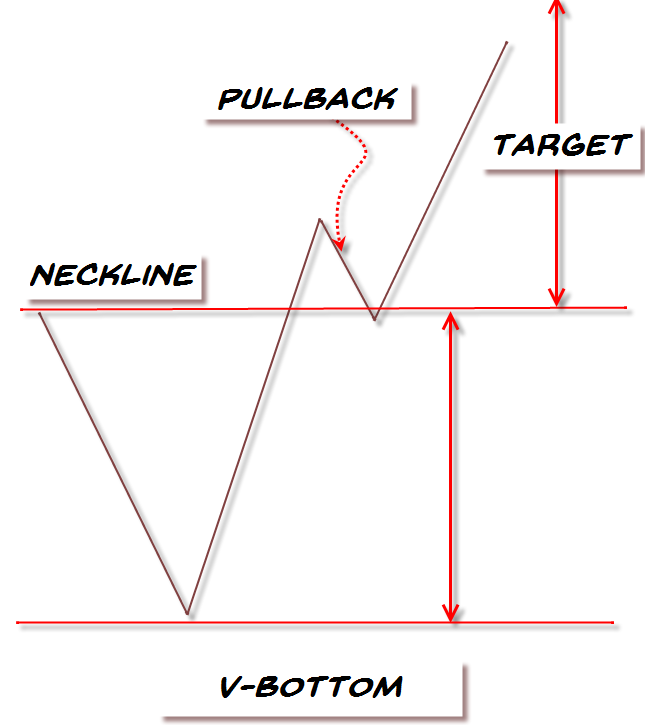
As the name implies, the "V" chart patterns have the letter "V" shape and prices shift their momentum from an aggressive sell-off (Bearish) to aggressive rally (Bullish) in its structure. It is relatively a rare pattern with extreme angles and maybe not easy to recognize until it is mostly formed. The V-Pattern is a powerful reversal pattern seen in all markets, all time-frames and in all instruments. The "V" pattern consists of rapid price action and may not be suited for all casual investors. The "V" patterns are formed when its trend is sharply switched from bearish to bullish (in case of V-Bottom) or bullish (or sideways) to bearish (in case of V-Top patterns).
Trading V-Patterns
The critical aspect of the V pattern is it must have a sharp downtrend followed by a quick and sharp uptrend reversal. Look for 1-3 bar reversals at the bottom of the pattern to signify the sharp reversal process. The volume increases during both the phases of the breakdown (down-shift momentum) and breakout (up-shift momentum). There are a few ways to trade this pattern, but the most conservative way is to trade a long entry once the pattern is complete and retraced back to the neckline (as a pullback). Aggressive traders may enter on the trendline breakouts at the bottom, but the success rate with simple trendline breakouts is low (52%) compared to the neckline breakout (64%) reaching its 1st target range 62-79% of its size from breakout level.
The key factors of the pattern identification.
1. Sharp Downtrend
2. Sharp Uptrend
3. V shaped Pattern (usually 1-3 bars reversals)
4. Volume increase in both breakdown and breakout phases
5. Breakout over neckline
6. Pullback to the Neckline
7. Target
Here is a diagram of the "V" bottom pattern
V-Pattern Examples
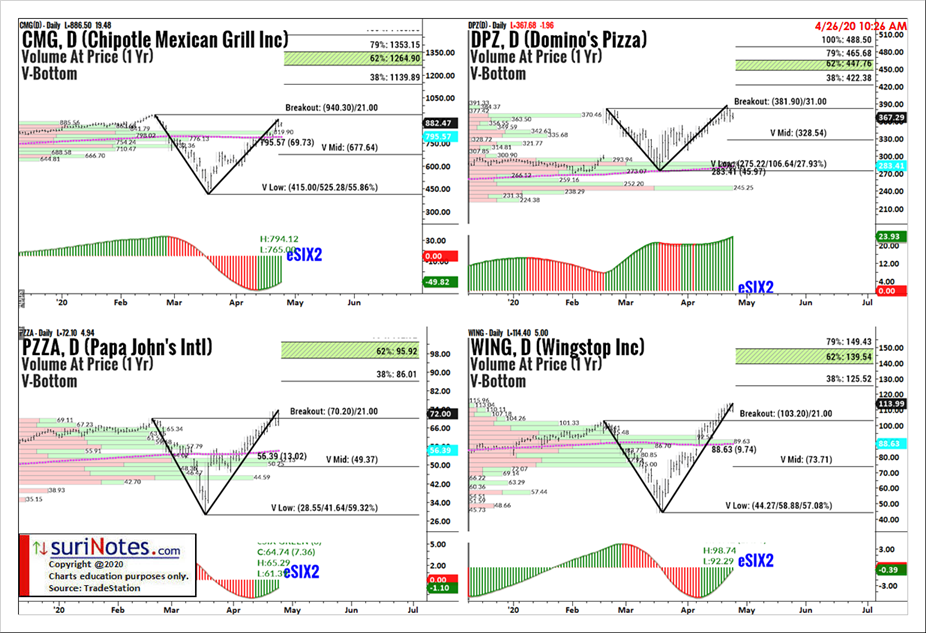
The following charts show fast-food restaurant charts with near-complete V-Bottom pattern formations.
Chipotle Mexican Grill Inc. (CMG) shows a V-Pattern formation from end of February 2020 to April 2020 as the price dropped from a high of $940.30 to a low of $415. The current breakout level is $940.30. If price breakouts from current level supported by the underlying V-pattern targets are set at $1139, $1264-1353.
Domino's Pizza Inc. (DPZ) shows a V-Pattern formation from the end of February 2020 to April 2020 as the price dropped from a high of $381.90 to a low of $275.22. The current breakout level is $381.90. If price breakouts from current level supported by the underling V-pattern targets are set at $422, $447-465.
Wingstop Inc. (WING) shows a V-Pattern formation from the end of February 2020 to April 2020 as the price dropped from a high of $103.20 to a low of $44.27. The current breakout level is $103.20.
Find more of Suri’s work at surinotes.com.


