

The E-mini is due a pullback, but not before it takes out the high from April, Al Brooks reports.
The E-mini S&P 500 reversed lower from a nested wedge top on the daily chart a week ago. However, last week it rallied and tested the top of the wedge. It will probably trigger the buy signal on the monthly chart before there is a pullback to 2600. The near-term upside is probably to 3,000 to 3,100.
The E-mini futures formed a big bull inside bar in April and it closed near its high on the monthly chart (see below). It is a buy signal bar for a two-bar (month) pullback in an 11-year bull trend.
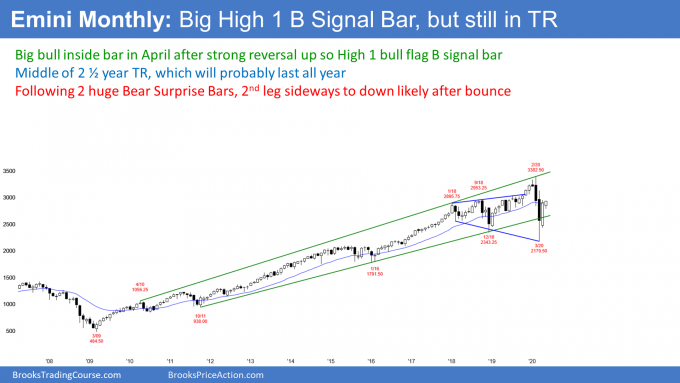
May is currently a bull bar closing on its high. It should break above the April high within the next couple of weeks. That would trigger the High 1 bull flag buy signal on the monthly chart.
It is important to note that February and March formed a Bear Surprise. Therefore, there is a 70% chance that the E-mini will have a second leg sideways to down before making a new all-time high.
When there is a bear surprise, about 20% of the time the pullback (rally) goes above the top of the Bear Surprise before there is a second leg down. But as I said, there is currently only a 30% chance that the seven-week rally will make a new high before there is a pullback.
And even if it does, there would still be a 70% chance of a second leg sideways to down. Consequently, the odds are against a strong resumption up in the 11-year bull trend without the monthly chart going sideways for at least a few months.
Even if the E-mini goes sideways for a few months, traders will still believe that the 2.5-year trading range is more likely to continue than it is for the bull trend to resume. They think that the upside potential is small over the next several months.
The E-mini futures chart formed a sell signal bar last week after poking above the 20-week exponential moving average on the weekly chart (below). Last week went below the previous week’s low, triggering a sell signal.
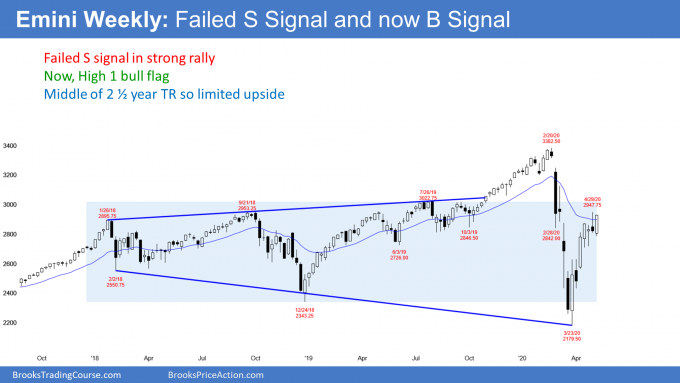
However, for six weeks, traders bought above the low of the prior week. Last week, the bulls finally had an opportunity to buy below the low of the prior week. They bought aggressively and last week closed on its high, making it a High 1 bull flag buy signal bar for this week.
It is important to note that the two-month selloff was incredibly strong. That makes it unlikely that this rally will break above the February high without pulling back for several weeks along the way.
The six-week bull microchannel is unsustainable and climactic. The two recent dojis are a sign that the trend is becoming more two-sided. Consequently, traders should expect a two- to three-week pullback to begin in May or June. The longer the rally lasts, the longer the pullback will be.
But the reversal up has been exceptionally strong. Traders believe that the E-mini should hold above the March low for the remainder of the year.
2020 trading range
What’s left? If the E-mini cannot get above the high or below the low of the 2.5-year trading range, that trading range will continue for the remainder of the year. The bottom of the range might be around the December 2018 low below 2400 and the top might be around the March 3 lower high on the daily chart. That is just above 3100.
Over the next few months, the E-mini will probably trade in a relatively tight range. It has been sideways between 2700 and 3000 for a month. It could continue like this for another month or more.
However, at some point in the next few months, it should retrace about half of the seven-week rally. That means traders expect a pullback to between 2500 and 2600 in May or June. Traders believe that the upside from here is not great. If a market cannot go one way, it typically tries the other way. Therefore, since a new high from this rally is not likely, traders expect the E-mini to trade down soon.
The E-mini futures reversed down the prior week from a wedge top on the daily chart (see below). The third leg up in the wedge was a micro wedge. That means that it is a wedge on a smaller time frame, like the 60-minute chart. There is therefore a nested wedge buy climax on the daily chart. A nested pattern has a higher probability of leading to a reversal.
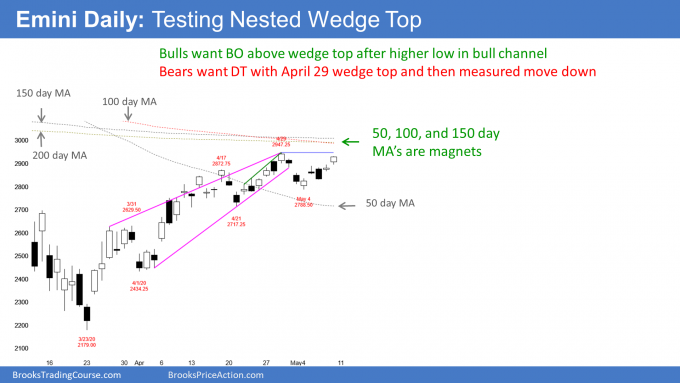
When a wedge top or any buy climax reverses, traders expect at least a couple legs sideways to down. The selloff typically reaches at least to the bottom of the pullback from the second leg up in the wedge. That is the April 21 low of 2717.25.
It usually continues down to around the bottom of the first pullback. That is the April 1 low of 2434.25. However, that target it probably too far down for the reversal down from this top to reach it. But, the E-mini might get there later in the year.
As I said, traders expect at least a couple legs down. That means there is a bounce at some point. It forms a lower high and then there is a second leg down. Traders are wondering if this week formed the lower high. It might have, but the monthly and weekly charts make traders believe that the E-mini will trade higher.
This wedge is also a tight bull channel
When a wedge top is a tight bull channel, about half of the time, the first reversal down will fail. Last week’s rally was strong. The April high is the top of the monthly buy signal bar. I mentioned above that the weekly chart has a buy signal. There are three moving averages (100-, 150- and 200-day) just above the April high. All of these factors make it likely that the E-mini will go above the top of the wedge before reversing down.
Once there is a reversal down, the pullback from the first leg down is a lower high major trend reversal. It often also is a right shoulder of a head and shoulders top.
Another guideline for the extent of the selloff from a wedge top or buy climax is that it usually has about half as many bars as there were in the wedge. The rally lasted six weeks and therefore I have been saying that the reversal down could be two to three weeks. It could be more, but not less. The longer the rally lasts, the longer the pullback will likely be.
If the E-mini breaks above the April high?
The top of the wedge on the daily chart is the April high. Remember, April is a buy signal bar on the monthly chart. The monthly bulls want the buy signal to trigger. They need the E-mini to go above the April high. As I wrote above, if it does, traders do not expect the rally to continue up to the February high.
If next week breaks above the top of the wedge, then traders will conclude that this wedge top on the daily chart has failed. They will then look for another pattern.
When the E-mini breaks above the top of a wedge, in general, there is a 50% chance of another reversal down and a 50% chance of a strong breakout with at least a couple legs up.
This depends on context. The daily chart is now overbought after a huge bear trend. In this case, there is at least a 60% chance that a break above the April high will reverse down again within the next couple of weeks.
Traders will then renumber the legs of the wedge. The old second leg was strong, and traders will then call it the new first leg. That is the April 17 high. The break above the April high will be the third leg. Traders would again look for a reversal down for several weeks.
What to expect next week
The E-mini will probably go above the April high within a couple weeks. This should happen early this week. That will trigger the buy signals on the weekly and monthly charts. It will also run the stops of the bears who shorted the wedge top.
It should also reach that cluster of moving averages around the 3,000 Big Round Number. The rally might continue up to the March 3 start of the parabolic wedge selloff.
But, it should fail between 3,000 and 3,125. There is only a 30% chance that it will continue directly up to a new high.
The longer it lasts, the deeper and longer the reversal down will be. At the moment, once there is a reversal, it will probably fall to below the March 31 high. That was the breakout point of the second leg up.
There is currently a gap between the April 21 pullback and that breakout point. Since the E-mini has been in a trading range for 2.5 years and gaps in trading ranges usually close, the E-mini should fall to below 2600 within the next couple months.
Trading Room
Traders can see the end of the day bar-by-bar price action report by signing up for free at BrooksPriceAction.com. I talk about the detailed E-mini price action real-time throughout the day in the BrooksPriceAction.com trading room. We offer a two-day free trial.


