

The EURUSD currency pair has come off its impressive three-week rally and may see a significant downward move, reports Al Brooks.
The EURUSD currency pair has rallied in a minor parabolic wedge buy climax on the daily chart. It should pull back for a week or two.
The EURUSD weekly chart rallied strongly for three weeks (see below). Last week it stalled at the bear trend line from the February 2018 high to the March high.
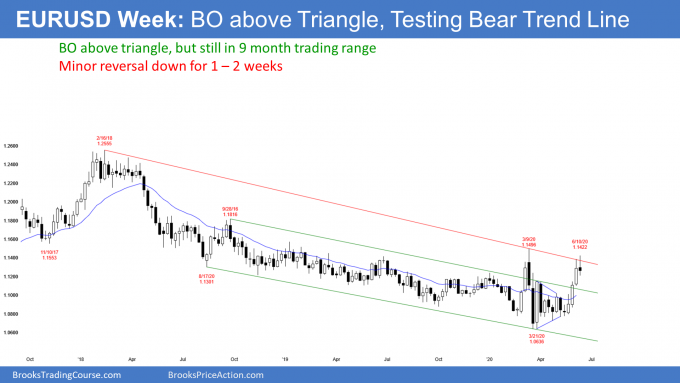
The bears see last week as a sell signal bar for another lower high in the two-year bear channel. They want this week to trade below last week’s low. That would trigger the weekly sell signal.
But the three-week rally was exceptionally strong. Consequently, there probably will be more buyers than sellers not too far below last week’s low. Traders expect a one- to three-week pullback and then at least one more test back up.
If the EURUSD reverses down a second time, there would be a micro double top. The bears then would have a better chance of a reversal back down to below the middle of the yearlong tight trading range.
Parabolic wedge buy climax on the daily chart
Take a look at the three-week rally in EURUSD on the daily chart (see below). The week of June 1 had consecutive big bull bars closing near their highs. In addition, they were the two biggest consecutive bull bars in the rally. They therefore formed a likely exhaustive buy climax.
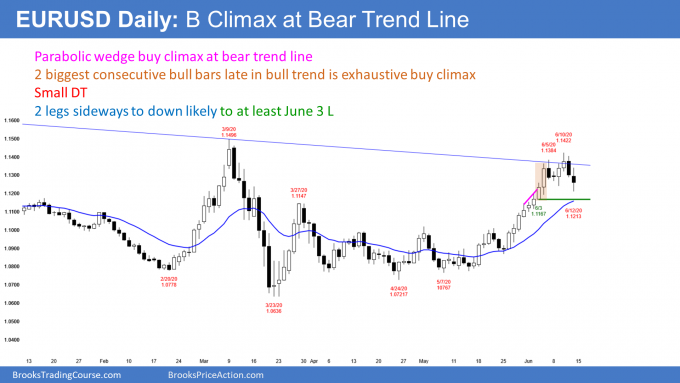
When there is a pair of big bull bars coming late in a bull trend, traders see them as a great opportunity to take profits. The bulls now have what they believe will be a brief chance to lock in windfall profits.
At the close of the second big bull bar, there is a 60% chance that either the two bull bars will be the end of the rally or that there will be one more brief leg up. There was a brief leg up last week that reversed on Thursday.
Downside target is bottom of most recent buy climax
Traders now expect at least a couple legs sideways to down. The first downside target is the bottom of that two-bar buy climax. That June 3 low is just below 1.1200 and about 200 pips down from this week’s high.
Many bears who sell the buy climax will take profits there. Additionally, the bulls see that the market rallied strongly at that price a couple weeks ago. They wonder if there will again be strong buying there.
The pullback to the bottom of the most recent buy climax typically results in at least a bounce. If the selloff is strong, many bulls will wait for at least a micro double bottom before buying again.
Can the reversal down be the start of a bear trend? A strong bull trend usually does not reverse into a bear trend without first transitioning into a trading range. Consequently, traders will assume that the 200-pip selloff will be a bear leg in a trading range or a bull flag instead of the start of a bear trend.
Trading Room
Traders can see the end of the day bar-by-bar price action report by signing up for free at BrooksPriceAction.com. I talk about the detailed E-mini price action real-time throughout the day in the BrooksPriceAction.com trading room. We offer a two-day free trial.


