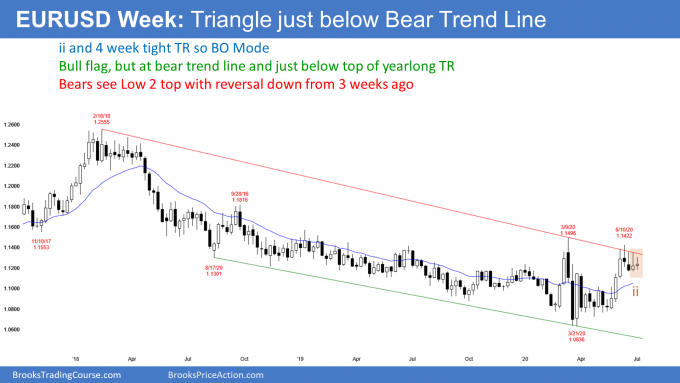
The Inside-Inside EURUSD Pattern indicates a bull breakout this week, reports Al Brooks.
The EURUSD currency pair rallied strongly in June up to the bear trendline. It has stalled there since and it has been in a tight trading range for a month. Because there is now an Inside-Inside (II) pattern, there will probably be a breakout up or down this week.
The weekly chart on the EURUSD has been in a tight trading range for five weeks. Last week’s low was above the previous week’s low. Also, its high was below last week’s high (see chart below). Last week was therefore an inside bar.

The previous week was an inside bar as well. There are therefore consecutive inside bars on the weekly chart. That is an Inside-Inside (II) pattern, which is a Breakout Mode setup.
Every five-week tight trading range is a Breakout Mode pattern. However, the II increases the chance that there will be a breakout this week.
With all Breakout Mode patterns, there is an equal chance for the bulls and bears. Furthermore, there is a 50% chance that the first breakout up or down will fail.
Given the context, who has the advantage? Sometimes one side has a slight edge, but not here. The strong rally favors the bulls. But the rally has stalled at the top of a two-year bear channel. That is good for the bears.
Does the breakout have to come this week? Not necessarily. Rarely, there is a third consecutive inside bar, which then is a III Breakout Mode pattern.
Trading Room
Traders can see the end of the day bar-by-bar price action report by signing up for free at BrooksPriceAction.com. I talk about the detailed E-mini price action real-time throughout the day in the BrooksPriceAction.com trading room. We offer a two-day free trial.


