

The EURUSD rally is slowing, a challenge to 2018 high requires a strong August, reports Al Brooks.
The EURUSD currency pair has eight consecutive bull bars on its weekly chart. This has not happened since 2004. Traders should expect a pullback at least to the June 10 high to begin within a couple weeks.
The EURUSD had a huge bull bar in July (see monthly chart below). It broke above a two-year bear trendline and above the September high. That was the start of the bear channel, and that is a magnet once the Spike and Channel Bear Trend finally ends.
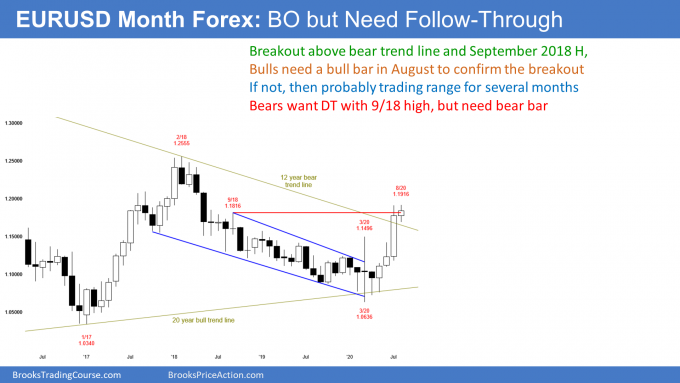
July was a Bull Surprise Bar. Traders expect at least a small second leg sideways to up.
But I have been saying for several weeks that August will be important. If August is a second big bull bar closing near its high, the breakout will probably reach the February 2018 high before the end of the year.
However, August will probably not be a big bull bar. Why? Because the first rally after a Spike and Channel Bear Trend typically stalls around the start of the bear channel. As I said, that is the September 2018 high.
If August is a bull bar, it will probably be small. While that will increase the chance of at least slightly higher prices within the next few bars (months), it would be a sign that the rally has lost momentum. Traders would expect the EURUSD currency pair to be sideways for a month or two.
What if August closes on its low? Then September will probably pull back. If August is a big bear bar closing on its low, not only will the bulls exit, many bears will sell. They will conclude that the July bull breakout will likely fail. They will see it as a bull trap and a double top with the September 2018 high.
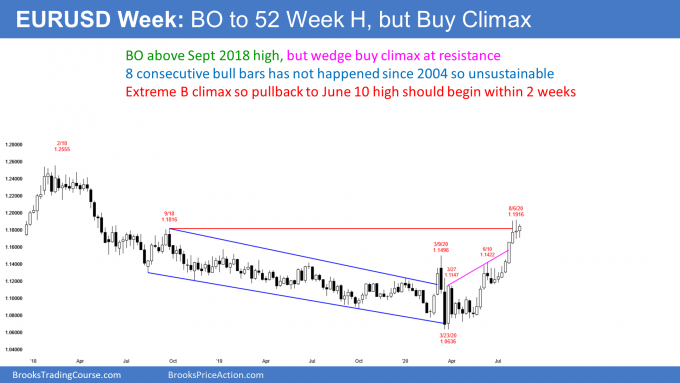
Last week was the eighth consecutive week on the weekly chart with a bull body (see chart below). That is unusual and therefore unsustainable. It is therefore a type of buy climax.
Traders expect a bear bar this week. This is especially true since the weekly chart has been sideways for three weeks. The bull trend is losing momentum. Also, the past two weeks were doji bars. They closed near the open. That means the bears were about as strong as the bulls.
Traders sense that the rally is climactic, but most are unaware of the eight consecutive bull bars and how unusual that is. The last time this happened was in 2004. The streak at that time was 11 consecutive bull bars. There was a small second leg up and then a yearlong selloff that continued down to below all 11 bull bars. That is an example of why I refer to this as a buy climax.
Will the EURUSD reverse to below the low of the eight-bull bars this time? It might because that is the bottom of the third leg up in the wedge. That is a common target for a reversal after a wedge.
Because the EURUSD has reached its most important target, albeit quickly, traders will probably be uncertain about what will follow. Confusion is a hallmark of a trading range, and the daily chart has been sideways for three weeks (see below).
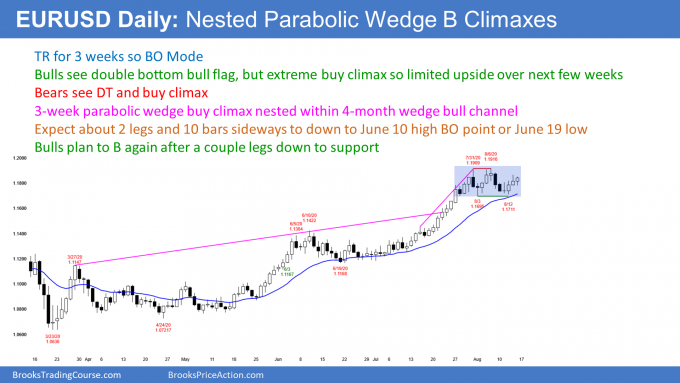
A trading range is a Breakout Mode pattern. There is a 50% chance of a successful bull breakout and a 50% chance of a successful bear breakout. Furthermore, there is a 50% chance that the first breakout up or down will fail.
Bears want a reversal down from a small double top
Every trading range has both a buy and sell setup. The bears want a measured move down from the small double top. That would be a test of the June 10 high breakout point. It might also fall to the June 19 start of the last leg up.
However, the bull trend has been strong. A reversal down — even to that low — would probably lead to a trading range and not a bear trend. There would probably be a test a few weeks later back up to the August high. Therefore, if there is a measured move down, there probably then will be a reversal back up into the trading range.
Bulls want the bull trend to resume
The bulls see the three-week trading range as a bull flag. But a bull flag late in a bull trend is usually the Final Bull Flag. This is especially true when there is a buy climax. The six-month nested wedge rally is a buy climax.
When there is a break above any bull flag, traders look for around a measured move up. But if the flag is a good candidate for a Final Flag, traders then look for a reversal back down to the bottom of the flag. Therefore, if there is a measured move up, there will probably then be a reversal back into the trading range.
Since a bull or bear breakout will probably return to the trading range within a month or two, the EURUSD daily chart will probably evolve into a big trading range for a couple months.
Trading Room
Traders can see the end of the day bar-by-bar price action report by signing up for free at BrooksPriceAction.com. I talk about the detailed E-mini price action real-time throughout the day in the BrooksPriceAction.com trading room. We offer a two-day free trial.


