

The rally in the euro has made a buy climax, so expect a test of support, writes Al Brooks.
The EURUSD currency pair has a parabolic wedge buy climax for the second leg up to a double top with the September 2018 high. This will probably lead to several weeks of selling to below the March 9 high.
On the monthly EURUSD chart, the two-month selloff in early 2018 was a spike down (see chart below). The bounce in September 2018 led to a bear channel, and the two-year bear trend was a Spike and Channel Bear Trend.
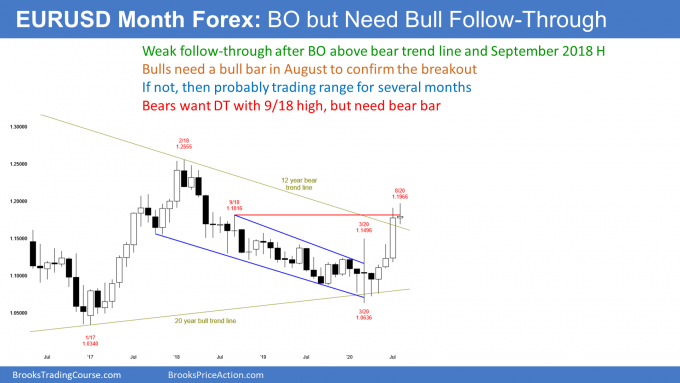
Traders look for a break above the bear channel and then a rally to where the channel began. That is the September 2018 high.
July was a big bull trend bar and it broke above that high. So far, August is a small bull bar. August is the follow-through bar, which always is important after a breakout. Will the breakout continue and lead to a trend, or will it reverse and lead to a trading range?
If the August candlestick has even a small bull body, traders will expect sideways to higher prices in September. If it is a big bull candlestick, traders will look for a test of the February 2018 high by the end of this year. That will probably not happen because a Spike and Channel Bear Trend usually evolves into a trading range.
If August closes on its low, traders will conclude that the July breakout failed. If August is a strong enough bear bar, traders will wonder if the EURUSD will undo the entire rally and test the March low.
August will most likely have either a small bull or bear body, and that will lead to a sideways to down September. The weekly chart below has a couple of reasons to expect lower prices.
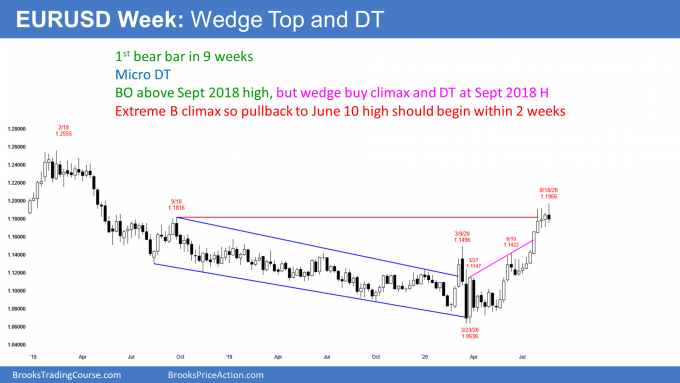
The EURUSD weekly chart has rallied strongly from the March low. But the rally has had three legs up in a tight bull channel. That is a parabolic wedge buy climax, which typically attracts profit takers.
This is especially true when the rally is testing important resistance. Here, the rally has stalled at the September 2018 high, which was the start of the 18-month bear channel.
Last week formed a bear reversal bar. It is a sell signal bar for this week. There is a parabolic wedge rally to a double top with the September 2018 high. That is a common combination that typically results in at least a couple legs down. A measured move down based on the height of the trading range of the past four weeks would result in a test of 1.14, which is around the June 10 high breakout point.
Reversing down from a Spike and Channel Bull Trend
The rally after a Spike and Channel Bear Trend typically tests the start of the bear channel. It then stalls and the chart evolves into a trading range. That is what is likely here.
The stop for the bulls is far below. They have to reduce their risk and the easiest way to do that is by taking some profits. They will probably begin to take profits over the next few weeks. If enough bulls take profits, there will be a reversal down. Traders expect a test of the breakout points, like the March 9 high and the June 10 high.
Streak of 8 consecutive bull bars
The bulls have an added problem. This rally has been too strong. There are now eight consecutive bull candles on the weekly chart. That is unusual and therefore unsustainable and a buy climax.
The last time that there was a streak of eight or more bull bars was in 2004. That streak was 11 bull bars. The EURUSD went sideways for a couple months and it then retraced most of the streak.
A streak like this in a trading range usually leads to a reversal down and the selloff typically retraces most or all of the streak. This current streak began with the June 26 low of 1.1169.
Will there be a selloff this year to that low? Probably not, but there should be a test of at least the March 9 high, which is about 500 pips below this month’s high.
Eight bull bars are climactic, but it also tells us that the bulls are aggressive. They will probably buy the selloff, even if it falls 500 pips.
It is important to note that it could be sideways for a month or two instead of down. However, after a streak, a market usually retraces at least half of the streak. Traders should expect lower prices.
Trading Room
Traders can see the end of the day bar-by-bar price action report by signing up for free at BrooksPriceAction.com. I talk about the detailed E-mini price action real-time throughout the day in the BrooksPriceAction.com trading room. We offer a two-day free trial.


