

Jeff Greenblatt notes that gold is underperforming, given the current environment.
As we head into the stretch drive of August paint drying season, the near-term bullish case for gold as well as the bearish case for the U.S. Dollar is hanging on by a thread.
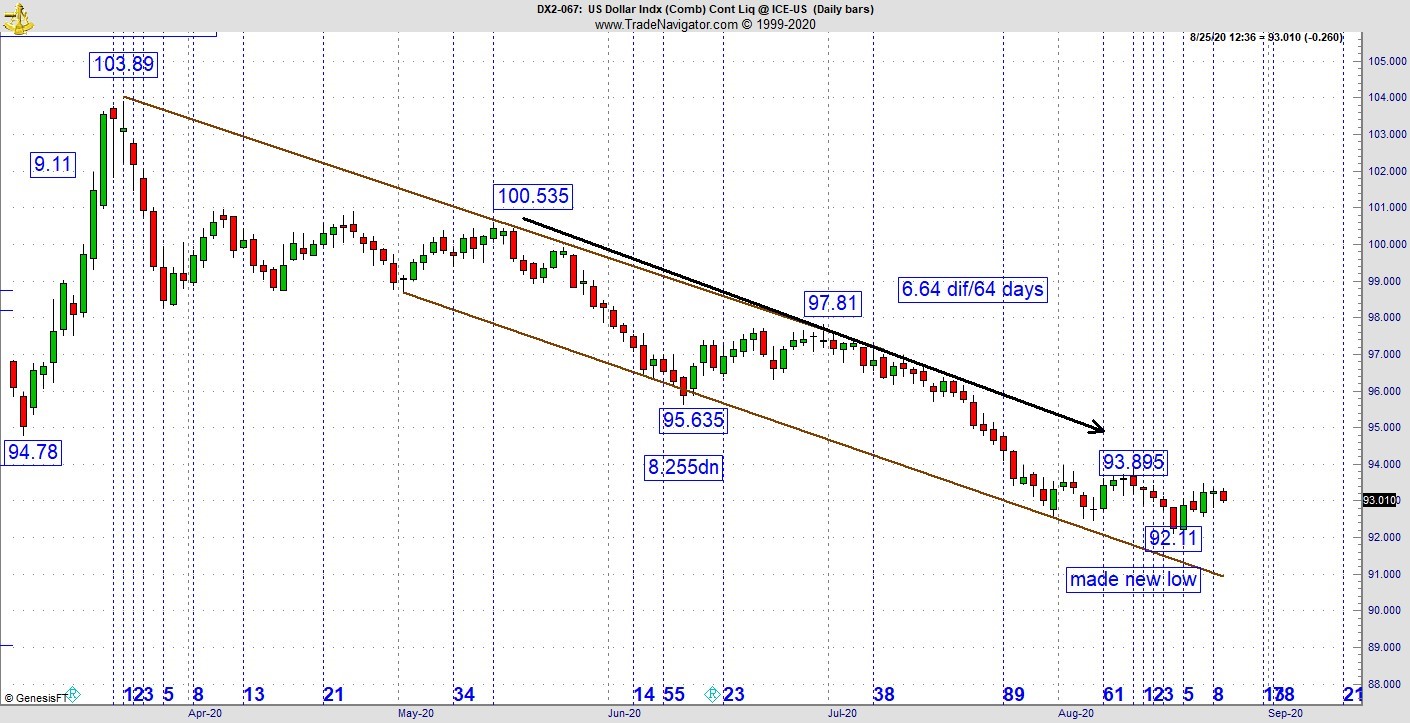
Let’s take a look. On the big intraday, otherwise known as the 180-minute chart, the vibration remains sideways (see charts below). The last leg down at 1.785 lines up with a 77% retracement to that prior high. If you are bearish the dollar, here’s what you need to be concerned about. We had a wonderful Kairos vibration on the daily chart at 6.64 and 64 days which I showed last week. It worked as far as a near term trade is concerned simply because it made a new low. But this is a puny response to an exceptionally good vibration.
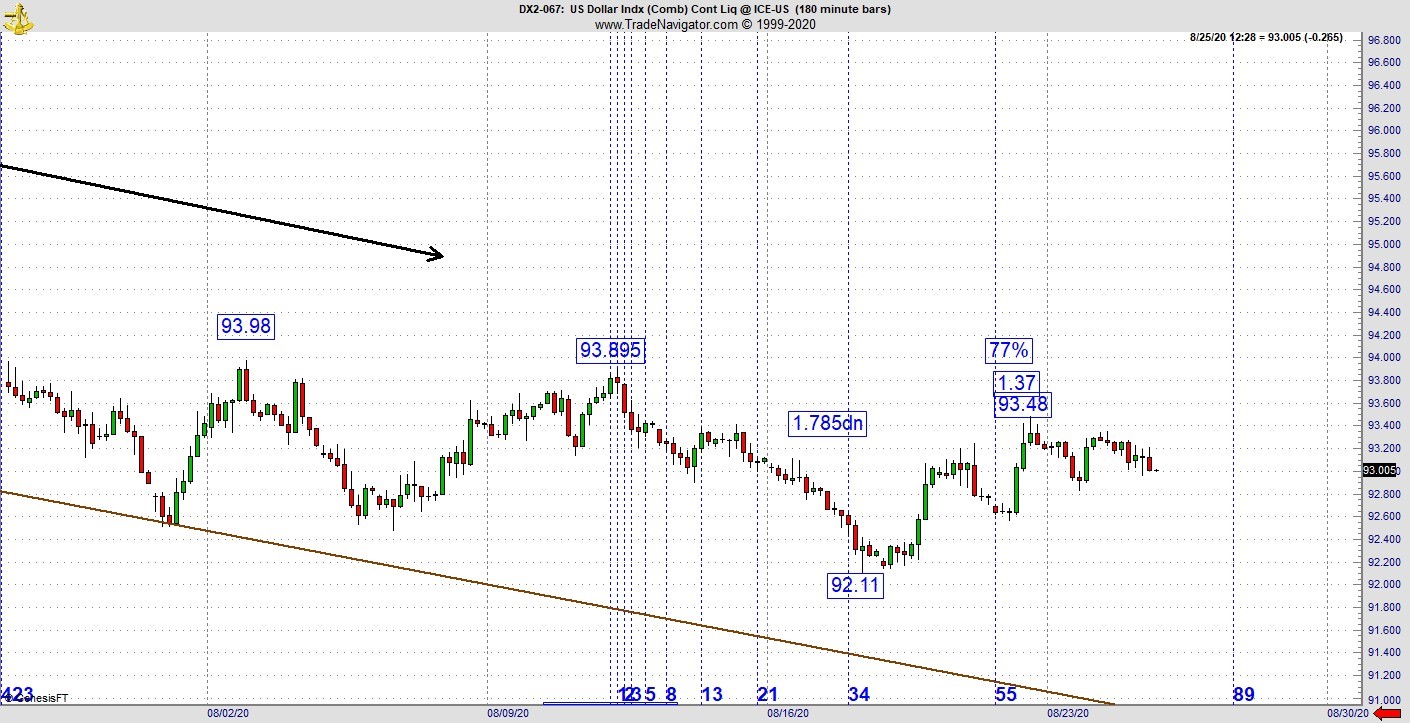
As financial markets are nonlinear in nature, there is no such thing as right or wrong. Everything is relative. The market doesn’t ring a bell to announce its intentions, one must read the tea leaves and become a good dot connector. The fact that a good reading didn’t produce much fruit could be indicative of a trend change. We must take the big and smaller picture and put it in context. By the way, this is a mistake many aspiring traders make on a regular basis. Your intraday pattern doesn’t trade in a vacuum. Everything is related and consider the intraday as only being a chapter in a larger book. All that being said, gold has been weak and right now we can see from the chart, gold is hanging by a thread. There was a bounce, which led to Monday’s high which is 53.7 points up but also 54.3 points from the prior high (see chart below). Now it dropped 51.2 points from Monday’s high but it’s also 50 hours from the prior low.
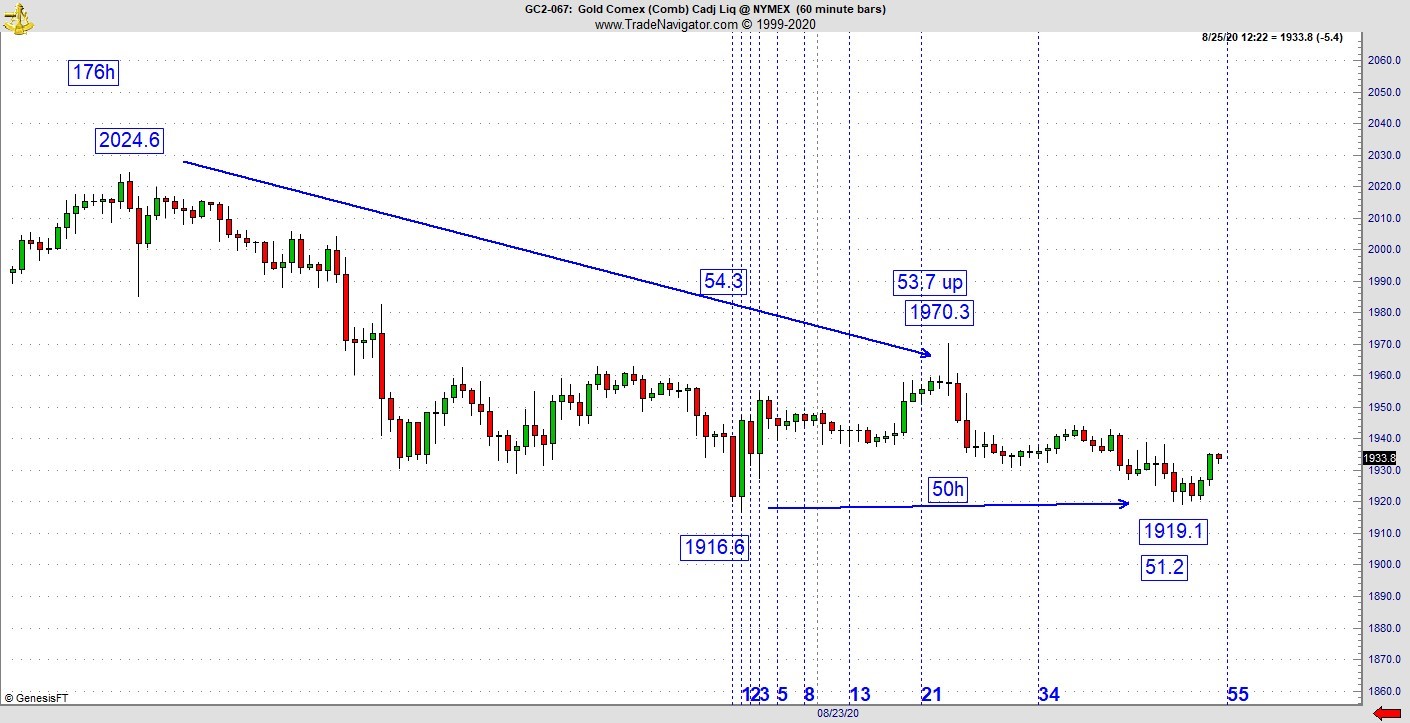
If this is new to you, realize we are looking at the pattern using an MRI to see what is really driving the pattern. Price and time vibrations are the most precise way to look at a chart. This low looks decent because it is a combination of price and time while the prior sequence of 53.7 and 54.3 are both price based.
Putting all this together, Al Brooks showed you that the EURUSD sitting on the edge of a major trend channel. That’s the bigger picture, he could be right as this is what is sitting under the hood. Nothing is guaranteed. Just because a pattern is sitting at the edge of a trend channel does it mean it will fail. We all know that. What might be supporting his view is a Greenback that hasn’t produced the big drop right here.
Nothing goes straight up or down but it is a little surprising to see precious metals do so poorly recently given the state of the world. But we know why this is happening. The Federal Reserve continues to keep easy money policies even as Congress has failed to produce the next stimulus package. There will be profoundly serious implications to this kind of inaction. I watch a lot of videos and there is a general theme emerging. Folks, we are in deep trouble. We are in much deeper trouble then many realize. I am grieved to see Manhattan looking like a ghost town. From what I’ve seen, according to numerous sources, 10% of the country is at least a month or two behind on the rent, with millions behind all the way back to March. We’ve never seen anything like this.
Millions of people impacted by this crisis realize even as the stock market continues its merry way. This nation appears heading to a catastrophe of biblical proportion. I took a lot of heat from certain sources because I came here week and week out warning you the Fed’s Repo bailout was the symptom of a bigger problem. Nobody wanted to hear it. That being said, many had a sense all throughout 2019 something bigger was going to happen. We just didn’t know what it was. Now we know. If you are a trader, most certainly you need to have a strategy to trade precious metals just as you do everything else. But in the long term, Gold should be going much higher.
If you want more information, go to: Lucaswaveinternational.com and sign up for the free newsletter.


