

While the stocks markets move has been impressive, Marvin Appel stresses that the strength is concentrated in a few mega-cap technology stocks.
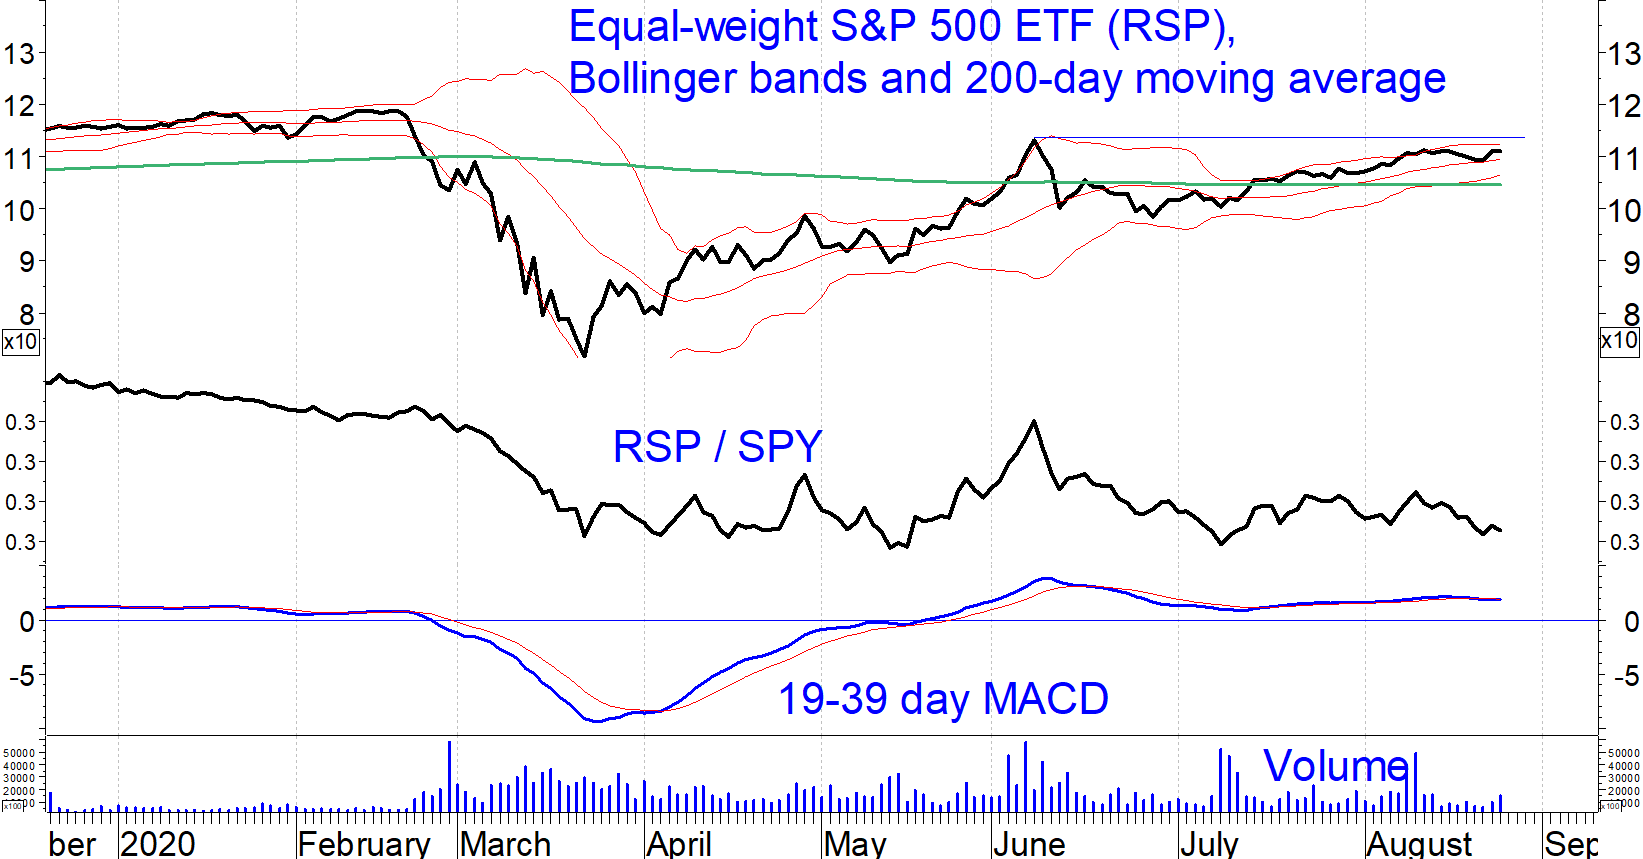
The S&P 500 and Nasdaq Composite continue to hit new records. Other areas of the stock markets are advancing but remain below previous peaks. For example, the chart below shows the equal-weighted S&P 500 Index ETF (RSP).
Note that it remains below both its June 8 and Feb. 19 levels, unlike the S&P 500 SPDR (SPY). Also notice that the RSP/SPY ratio is right about where it was when the market bottomed. This is unusual, as smaller stocks historically fallen harder during bear markets but recovered better after the bottoms were in.
The underperformance of small-caps relative to large-caps is the sharpest since the late 1990s (see chart below.) However, historical precedents do not suggest whether small-caps have sold off to such a great extent that they are due to recover their relative strength.
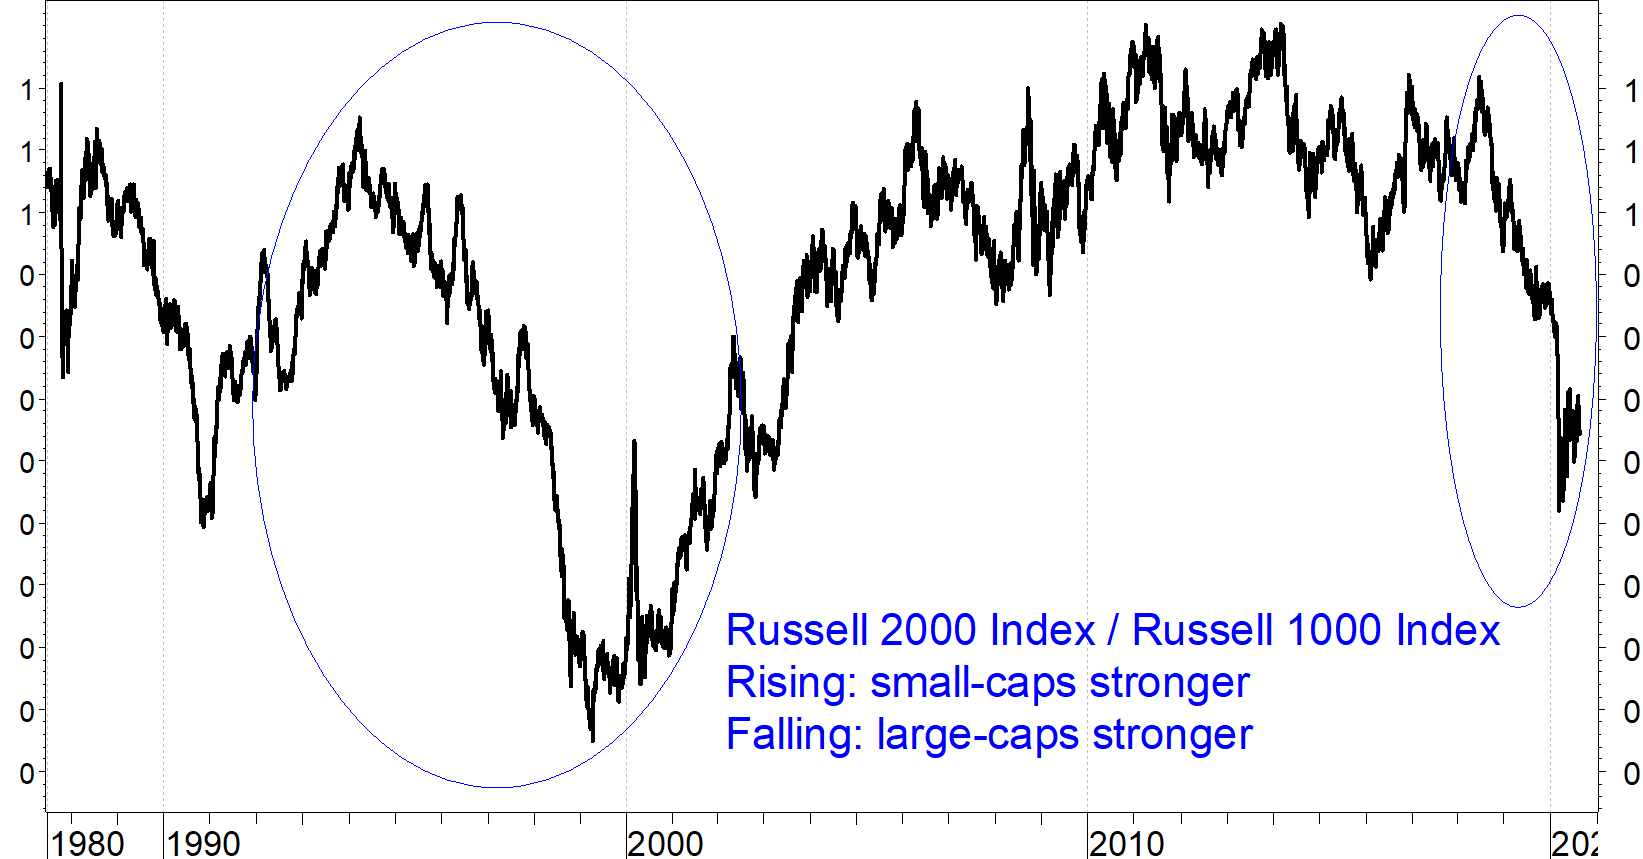
Figure: Russell 2000 Index (small-cap benchmark) divided by Russell 1000 Index (large-cap benchmark). The greatest favoring large-caps over small-caps occurred from 1994-1999 (circled), much larger than the current trend favoring large-caps (circled on right side of chart).
The chart also shows that over the 40-year history of these indexes, small-caps have slightly lagged large-caps. That trend should remain intact or intensify; We find ourselves in a winner-take-all economy where larger companies have increasingly greater structural advantages as industry after industry consolidates. As a result, there is no reason to maintain a permanent small-cap index exposure. Rather, you should use small-caps as a tactical tool, adding exposure after significant market corrections.
That approach would have worked in 1991, 2003 and 2009 but not this year.
Technology sector chart shows strong uptrend
We remain in a relatively narrow market where the gains are concentrated in the technology sector. The tech sector has been the strongest of the S&P 500 sectors over the past five years, but its dominance has accelerated in recent months. Other strong sectors this year include Consumer
Discretionary, 24% of which is Amazon (AMZN) and Communications Services, nearly half of that is from Alphabet (GOOGL) and Facebook (FB).
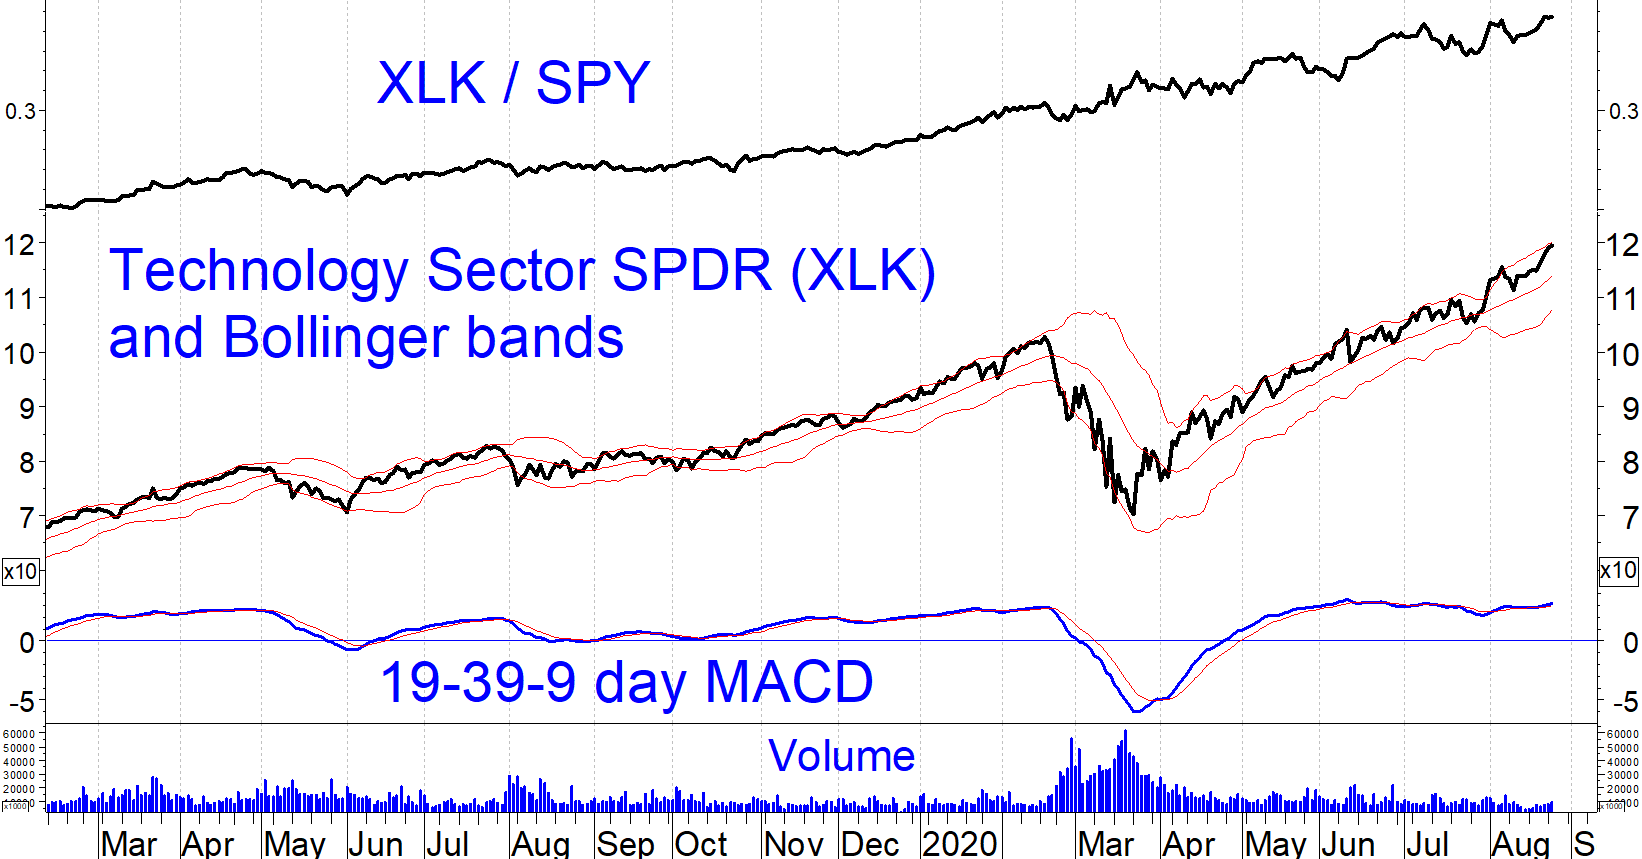
The chart below shows the unrelenting uptrend in the Technology Sector SPDR (XLK) since March 23. The XLK/SPY ratio has been rising consistently for several years (meaning that technology has outperformed the S&P 500). MACD is flat at an overbought level. In the setting of a strong uptrend, an overbought MACD is not a reason to sell. Interestingly, MACD is more stably overbought now than it was during the height of the tech bubble in 1999-2000, when the tech rally occurred in bursts.
The bottom line is that there is no telling from the technicals how long the tech rally will last. It is dangerous both to put all of your eggs in the tech basket now as that trade is very crowded (See Joon Choi’s article on page 5), but also to try to bottom fish in other areas to the exclusion of technology. I advise sticking with the S&P 500 SPDR for sector diversification but with exposure mainly to large-cap stocks.


