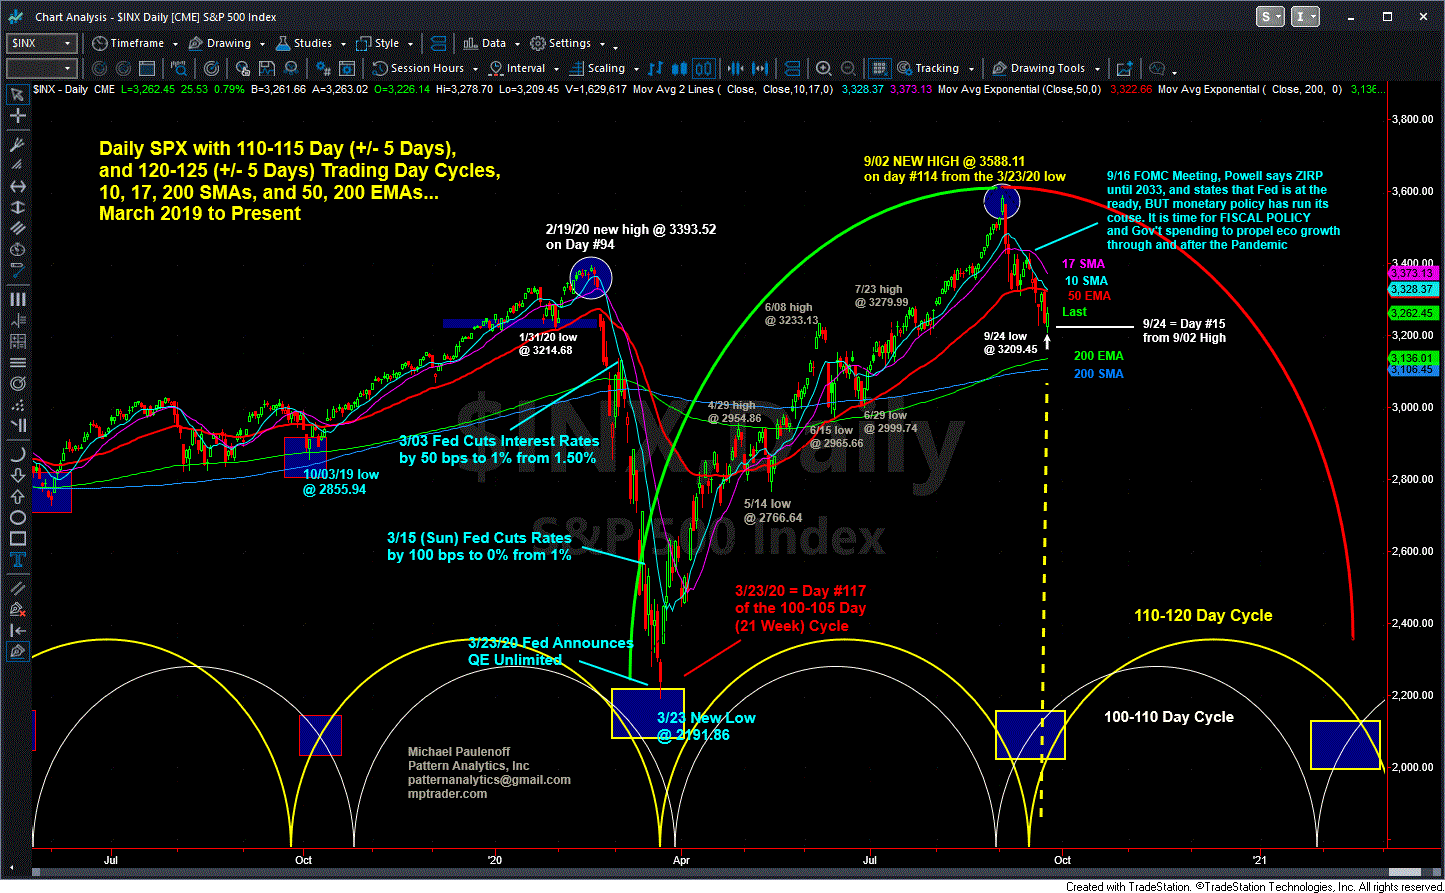
Typically exhibiting a 100 to 110 trading day cycle from low to low, the S&P 500's cycle low on March 23 was actually 117 days after the prior cycle bottom in October 2019, says Mike Paulenoff of MPTrader.com.
The 117-day cycle that hit its low on March 23 initiated a new cycle that—owing to massive Federal Reserve liquidity injection—climbed relentlessly for 114 days into the September 2 all-time high at 3588.11.
After the unusual circumstance of seeing an SPX cycle morph into a one-way directional move (rather than say, 90 days of relative upside followed by 15-20 days of relative weakness), going forward I will not be surprised if the new cycle that commenced after the September 2 cycle high is a mirror image of its predecessor, meaning 115 to 120 days of net bearish price action.
Thursday was day #15 of the cycle that began on September 3, the day after the all-time high, and the SPX has declined from 3588.11 into Thursday's low at 3209.45, or 10.5% so far. The decline has sliced and sustained beneath my 10, 17, and 50 DMAs, which did not happen in March-September up cycle. And all of the MAs have rolled over into negative slopes clustered in the 3322 to 3372 resistance zone, which will be very difficult for SPX to overcome in the absence of some new bullish catalyst.
In the absence of a bullish catalyst (economic, monetary, political), the SPX will have an upside cap at 3290-3320, with the declining MAs placing increasing downward pressure on a price structure that is destined to confront its 200 DMAs, now at 3106 and 3136.
My suspicion is that the entire cycle from early September 2020 to its theoretical bottoming period projected for late-January to late February 2021 will be the directional opposite of the March 2020 to September 2020 cycle, and will be characterized by a series of downlegs interspersed with failed, truncated rally efforts.

Mike Paulenoff is co-founder of MPTrader.com, a live trading room featuring his analysis on the key key market indices and bellwether stocks & ETFs.


