

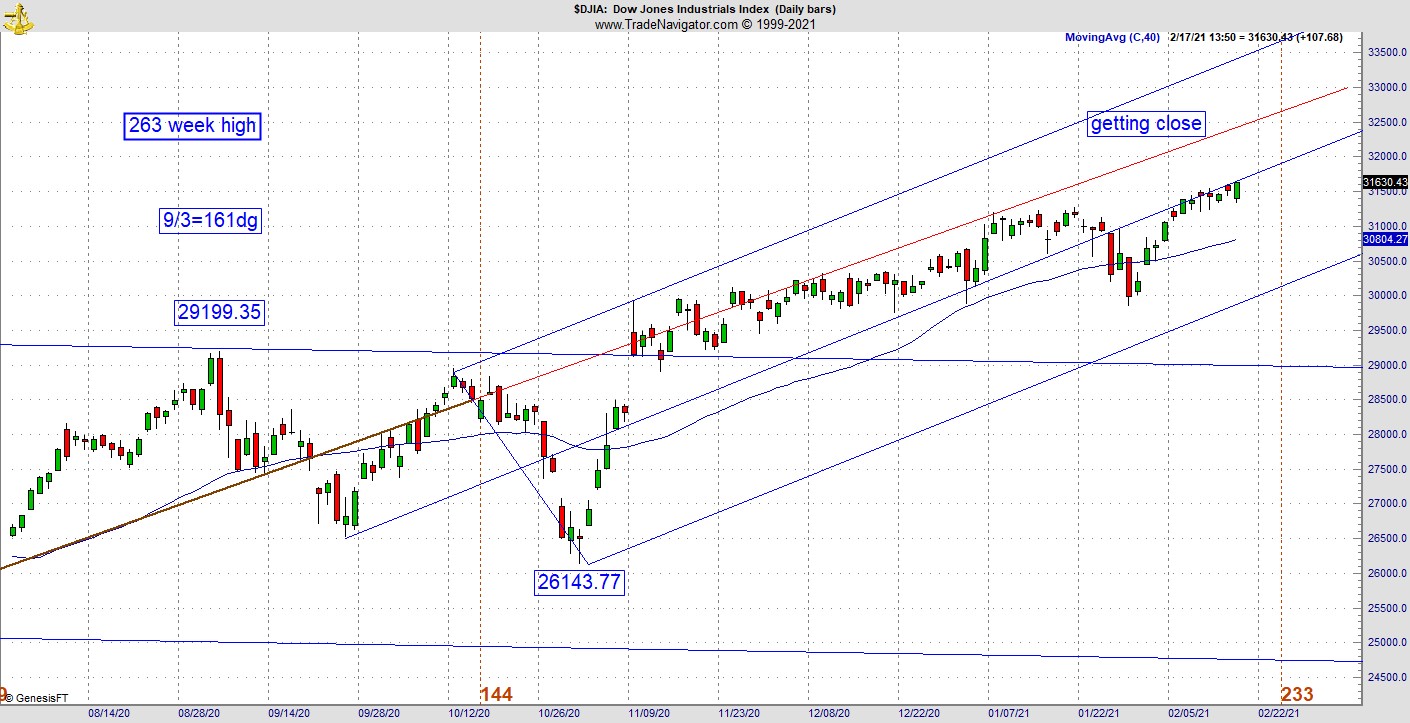
We are now a week out from the 233rd day of this rally from March low of 2020. This is also the 144th month cycle to this rally coming off the bottom in 2009, explains Jeff Greenblatt of Lucas Wave International.
Does that mean something is going to happen? Not necessarily but I’ve been telling you for years that in situations such as these, risk becomes extremely high. Something doesn’t have to happen, but it could happen, and we will also soon be around the anniversary of the financial crisis bottom (March 6-9).
What could possibly happen to manifest a turn? Who knows but thinking outside the box, how about the weather? Did you notice the earthquake activity is up? Those of you who follow the ring of fire will realize activity below the surface is starting to activate. Let’s be clear, I’m not predicting the big one. That being said, just look at the weather. We are dealing with it from every angle.
Turning from nature, Congressional leaders have pledged to approve Biden’s $1.9 trillion stimulus before the end of February. Millions are waiting on stimulus and/or the extension of unemployment benefits. If it doesn’t happen the market would likely sell off. I believe this extension has already been priced into the market. Unless a major war breaks out, this covers a lot of the possibilities.
I know you are reading this because you want to know what causes the biggest moves. Some believe it’s the news event. Others believe in the fundamentals. If fundamentals really drove stock prices the Dow would be at 10,000, not 30,000. For every important news event that seemingly drives the prices, there is an underlying price and time vibration that set up first. The problem is Wall Street doesn’t talk about it because once upon a time a guy named Malkiel wrote a book called A Random Walk Down Wall Street. Sad that a whole generation of investors believed it.
There was another smart person who said the better the move, the more complex the setup is going to be. I apologize for not catching his name, but I saw it in passing on some video I was watching a few months ago. You know it's true because the market is good at not revealing its plan until it’s about to happen.
As you know, I’ve been working my cycles for nearly 20 years. But it has only been the last six-seven years that I started working on my Kairos vibrations very seriously. What ended up happening is I became a student of big moves. If I saw a big move, I had to study the vibrational work to see how it set up. At first it was incredibly complex.
There are probably 10-20 tendencies that repeat all the time. What does that mean? Patterns are like snowflakes. While so many are similar, no two are ever exactly alike. So, you’ll need to draw from your reservoir of knowledge to know what to look for. Knowing what to look for is more than half the battle.
Over time I started getting it, but I could not figure it out in real time. I’ve shown you the most precise way to buy pullbacks or sell bounces. Some of those are simple but not easy. But after you’ve seen hundreds of these setups when you know what to look for it’s a lot easier to find them. But at some point, I finally saw the number sequences and found what I call the sweet spot where it all lines up at the speed of the market. The better the vibration in many cases, the better the move. I showed you a good one last week. Here’s another one and it's on the Dow E-Micro.
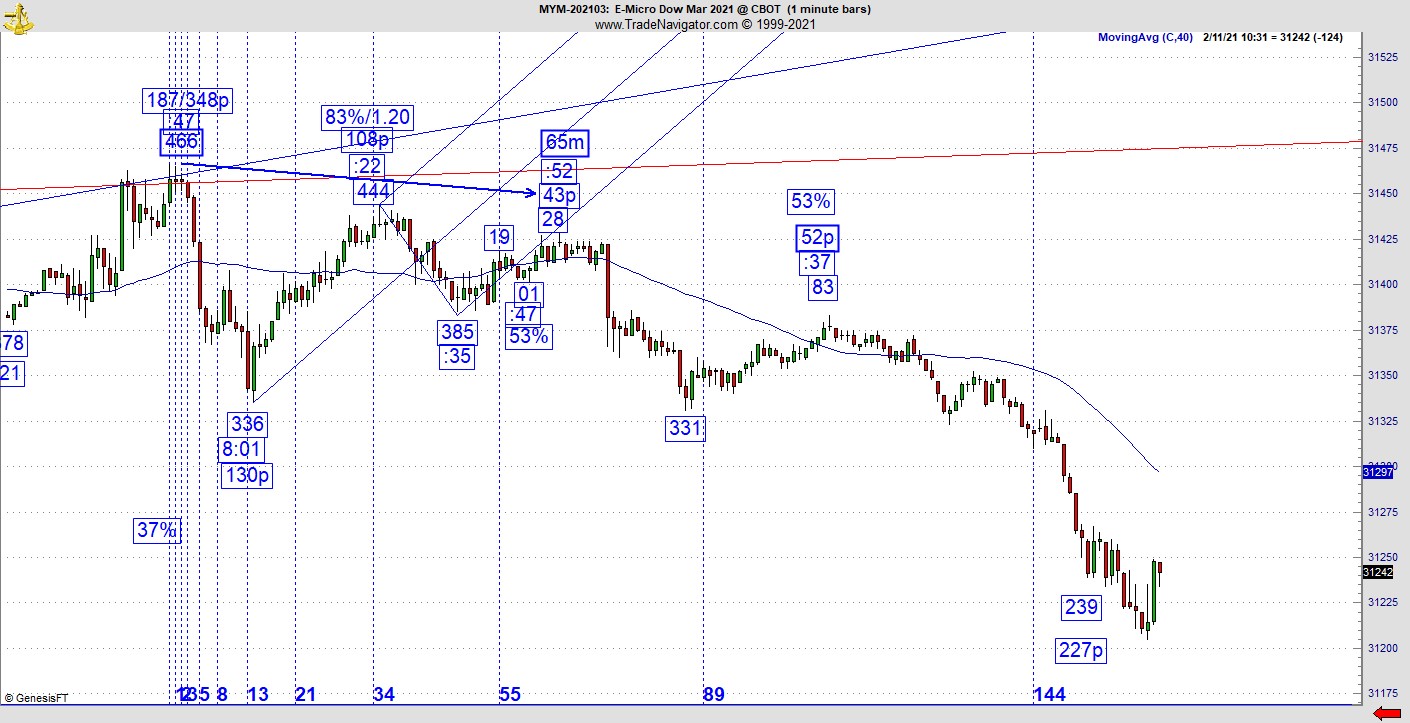
Look at the high, the annotation says 466 but it's 31466. I put a channel on most of the things I do because it’s the best indicator of strength I can think of. Those of you who use the ADX probably have realized by now it does not work on intraday charting.
So, here’s a situation where it squares out at 65 minutes from the 466 high. Note the channel and as it falls out of the channel, it squares out. Then it drops. Also note the 65-minute square out is at :52 minutes after the hour. Prior to the 65 square out pivot is the 444 pivot that is 22 points less than 466. That one hits at :22 minutes after the hour.
The next bounce leg ends at a range of 52 points up and it’s a 53% retracement, which leads to the best part of the move. It is complex to be sure. How many would think to look at the clock when the secondary high is 22 points less than the top? By itself, it means nothing. Throw in the :22 and you have everything.
I know I’m showing you a one-minute chart and it’s been my laboratory for years. Everything I’ve found on a one-minute chart can be applied and adjusted to other time frames. For those of you who do want to trade a one-minute chart, understanding vibrational work like this will slow down the action so you’ll never be caught like a deer in the headlights.
If you want to do well in this environment many of you will need to take your game to next level. There is so much going on and it's hard to say exactly when the bubble will pop. What I’ll leave you with is right now many are able to make money on the long side because it’s an all-in-one way market thanks to Fed intervention in every way you can think of. When that comes to an end and the only way to make money is on the short side, will you be ready?
Fore more information about Jeff Greenblatt, visit Lucaswaveinternational.com.


