

Recently, I told my posse to look out because there was an interesting development in gold. Kairos was pointing to the pattern drawing a line in the sand of support to do some upper testing, explains Jeff Greenblatt of Lucas Wave International.
This has now materialized, but at the same time a caveat about not getting too excited. If you look closely, on Tuesday it left an upper tail and it could’ve been a case of here we go again, but it wasn’t.
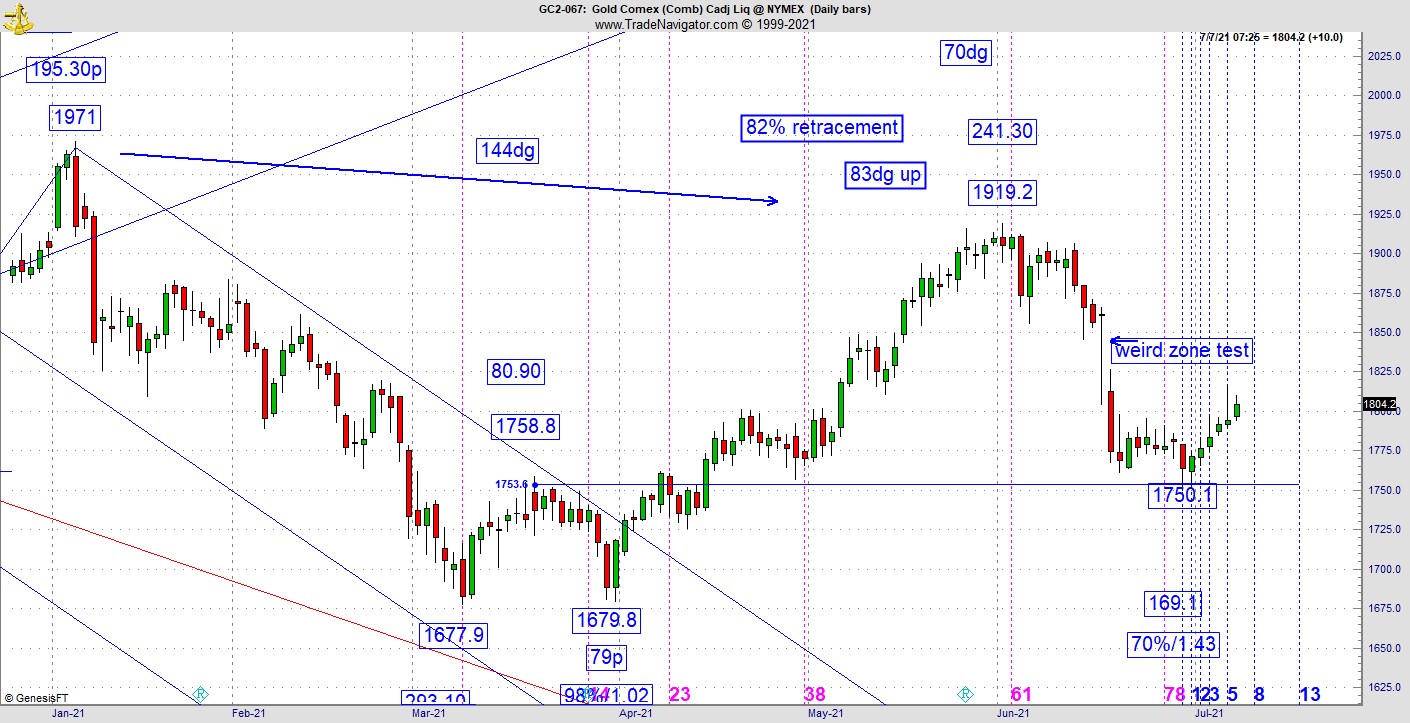
Wednesday’s candle regained some of what was given back. Why did traders get queasy in the first place? Look at that lower tail bar right in the middle of the drop. We don’t see patterns like this very often. The initial projection was modest as this “weird zone” has to be retested and this could go on for several days. This is the same modest projection I told you about in late May when Bitcoin found the low. Bitcoin has settled into the consolidation we were looking for.
Another takeaway thus far from the gold lift is that Bitcoin has not joined it in sympathy. Bitcoin did have a major violation of our 57 square out of the bottom and it's possible this is the best we are going to get as there is still major risk for a fresh thrust lower. Concerning the banks, the BKX is struggling to hang on. Ideally, this retest of the channel line should’ve held while the price action inches up the line. It can still recover but the channel break represents a weakening of the pattern overall.
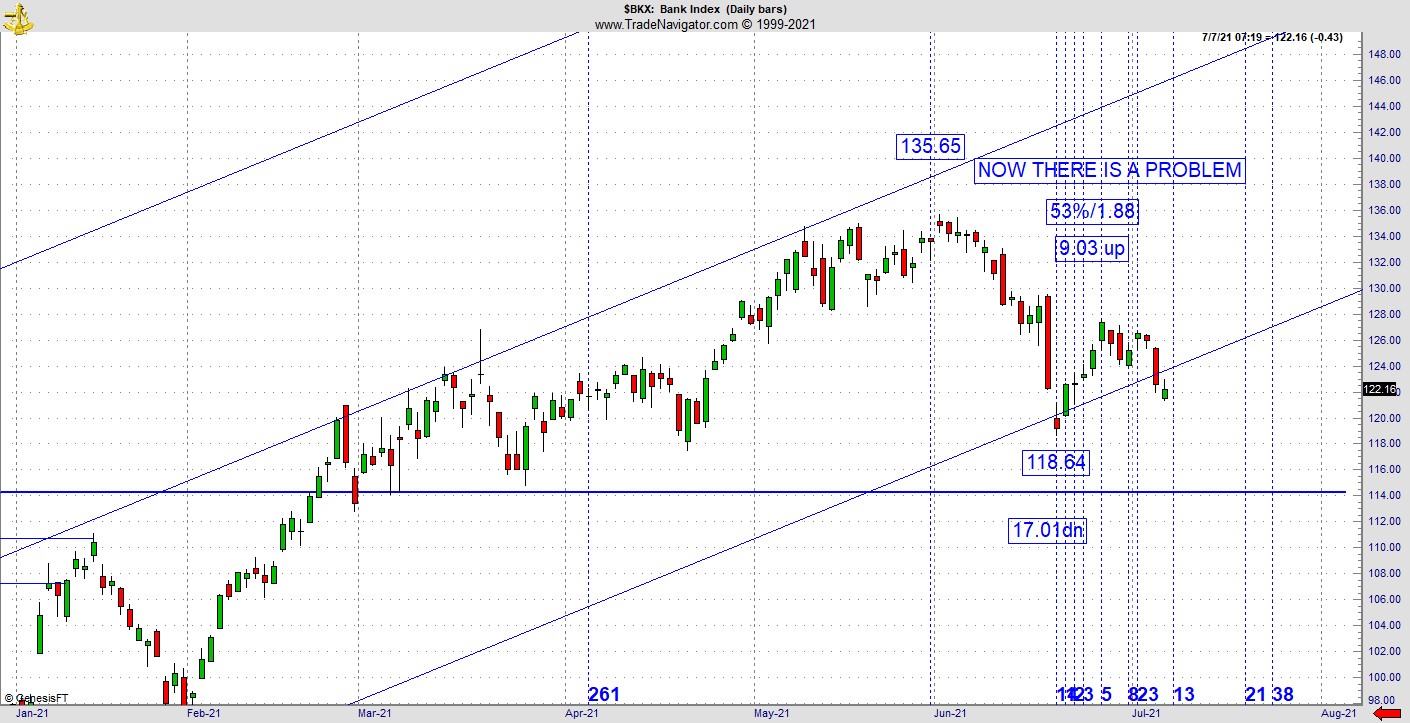
My problem with this chart has always been the major support is the 2019 high, which was former resistance but has the chance to flip polarity and become support. The problem is it still could get there, which would represent a complete violation of the uptrend and once a snowball starts rolling down the hill, nothing might stop it. The bottom line to the BKX is even if it hangs on from here, its days are numbered. I’m sure we’ll find out down the road, but this chart is telling us there is an underlying problem under the hood, which is starting to manifest.
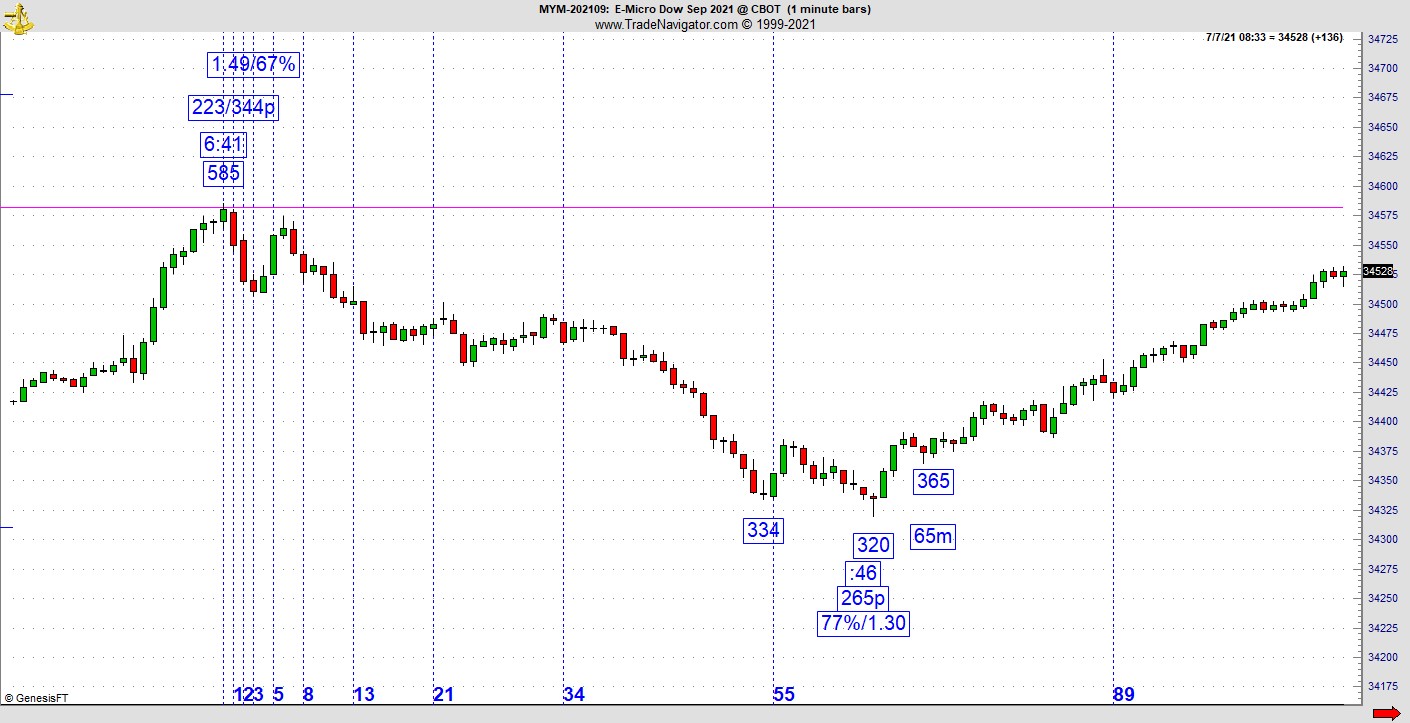
So, I’ve come up with an intraday clock that works similar to my Gann calendar, but it recalibrates every 24 hours and embeds its influence on the smaller time frames. First, here’s a conventional price and time setup from Wednesday morning. There was a quick 265-point drop in the Dow futures, which manifested in 65 minutes. The buy signal hit when the first secondary low was 365. That is not a coincidence and became the buy signal for a thrust of over 200 points in less than an hour.
Here’s a brief introduction of the intraday clock. This is the first time I’ve seen this tendency, but if you’ve been following my work over the past year this should look familiar as I’ve shown you similar setups, but they were on a daily chart. These readings are on a four-minute chart.
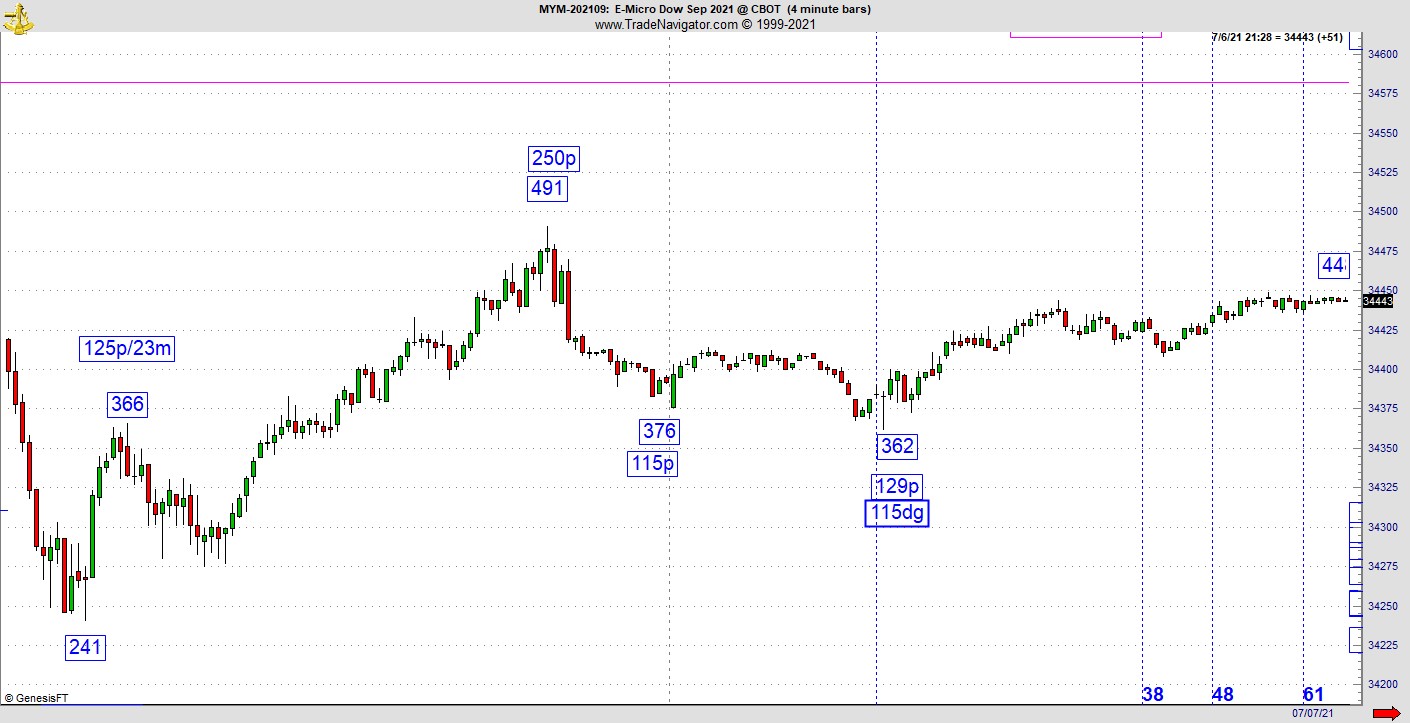
In essence what we have is an ABC pullback where the first leg down to 376 is 115 points. The pullback terminates at 115dg for the pattern. This action was from Tuesday night and by early Wednesday it did hit the purple line at the top of the picture, which represented yet another key Kairos point to the pattern. Some of you might recall I taught a very comprehensive foundation to Kairos at my master class at the 2019 NY Traders Expo. Now I just keep adding to the playbook.
If you’ve been following my work, you know how nicely the Gann calendar integrates into the pattern, the intraday clock does the same thing. One of the best parts of using this methodology is we don’t need any of those complicated grids or circles that Gann used but never explained to the public. My motto is if you need anything more than a pen and calculator, it's too complex to use in trading. As sophisticated as this looks, I work to avoid anything, which promotes paralysis by too much analysis. These market tendencies are no more complex than an NFL playbook. If a 22-year-old kid can learn an NFL playbook, any trader can learn to do this. The challenge is that one must have the fire in the belly to get to the next level and beyond to do it.
The takeaway from this discussion is the following. With the S&P 500 (SPX) sitting at all-time highs, we have a profoundly serious divergence working with the exact wrong chart none of us wants to see on the ropes. This is now a divergence that could play out all summer. Don’t forget August is the beginning of the massive 161-month window on the US dollar.
Gold might be waking up and I already see the precious metals crowd calling for a fresh leg up. Not so fast because the pattern has to overcome that weird candle manifestation. Finally, the price and time readings are pure because no indicators are needed other than a tool like the pitchfork, which helps us navigate the trend. It is the most precise way to buy pullbacks or sell rallies.
For more information about Jeff Greenblatt, visit Lucaswaveinternational.com.


