

Markets always like to throw a curveball when we least expect it. Today we’ll unpack it, explains Jeff Greenblatt of Lucas Wave International.
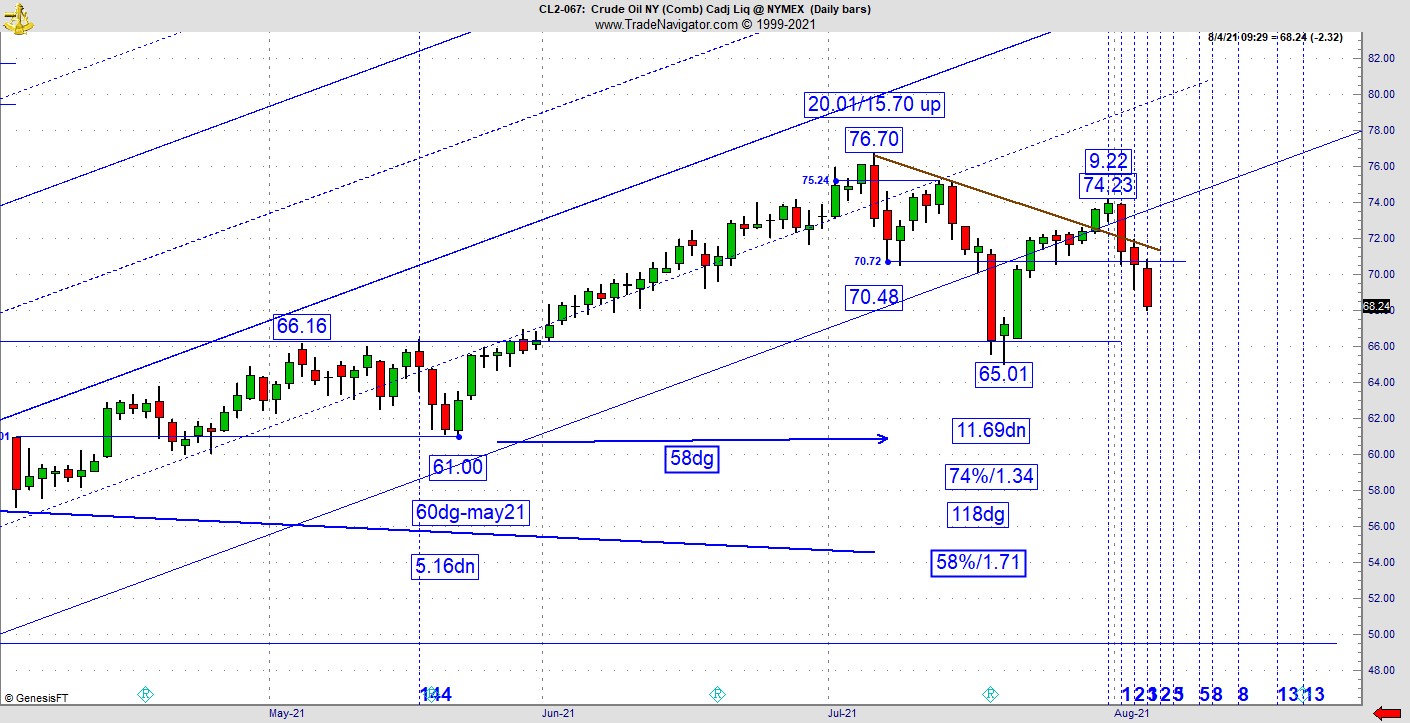
Recall last week oil was sitting right on the fence post. It was right there on the larger channel line as it was testing a natural near-term overhead trend line. I looked at a couple of scenarios. As it turned out, I was probably wrong about that scenario.
The truth could be more serious than I thought. I offered up a scenario where Transports would drop just because oil costs (based on a potential bullish thrust) would go through the roof. Turns out that if oil continues to do what it just started doing, it could be an advance indication of future economic activity. At the very least, in the past few days the pattern has slipped out of a bullish channel it was struggling to hold in the first place.
Where are we going with this? Let’s go back to the origin of this mess. Oil came off the high on July 6th only to test polarity where our very good vibration caused the anticipated reaction. If a reading that good can’t hold, something bigger is developing. So, if this impending retest of polarity fails, it could take the whole market, and ultimately the economy, down with it. Bold words for sure however polarity hasn’t failed yet. That being said, the oil chart throughout this century has been a particularly good advance indication of future economic activity.
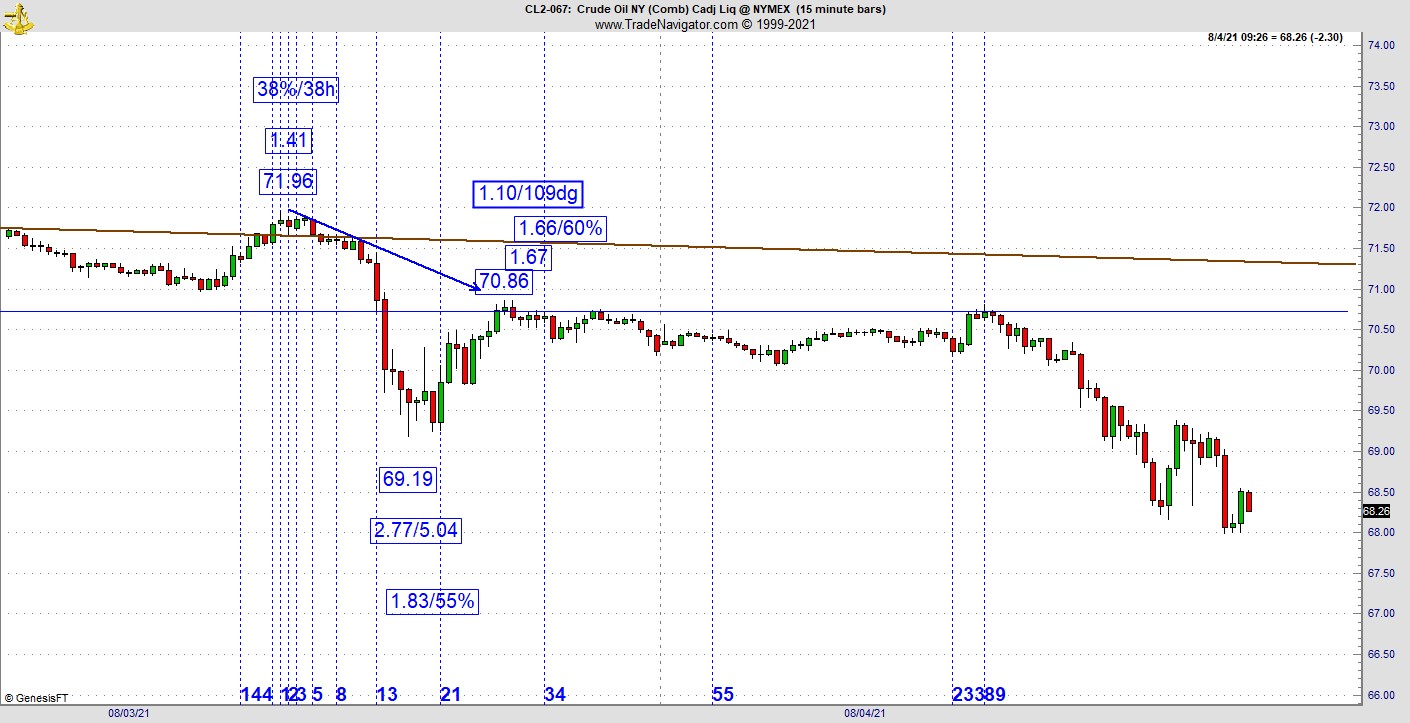
While I’m on oil, lets take a look at how the intraday clock impacted the latest push. Not visible on the daily, the under-the-hood work was accomplished on the hourly and 15-minute time frames. First bounce was a 38% retracement in 38 hours and then high to high dropped 1.10 at the same time the intraday clock registered 109dg. Simultaneously, the bounce was 1.67, which created a retracement/inverse slash line of 1.66/80%. In case you don’t understand any of this, your takeaway is the drop out of the bullish channel was accomplished by a confluence of really decent price and time relationships. Of course, the low was also accomplished on even bigger vibrations and is likely a key acid test for the entire economy.
Not to be outdone by interesting time relationships is the US dollar, which has now reacted at the exact time I anticipated over a week ago. As you know we are now in the initial stages of the big 161-month window, which could last through October. You also know the ideal technical scenario would be a completion of the move, which started in January right at the upper descending channel line. They started taking it lower, but I was looking at the range to the low, which was 14.695. Since we were around the 144-day mark, I saw a square out point coming at 147 days (moving the decimal point). Just as Gann would’ve expected, this reaction came right on schedule. Here’s my problem which is a good one to have.
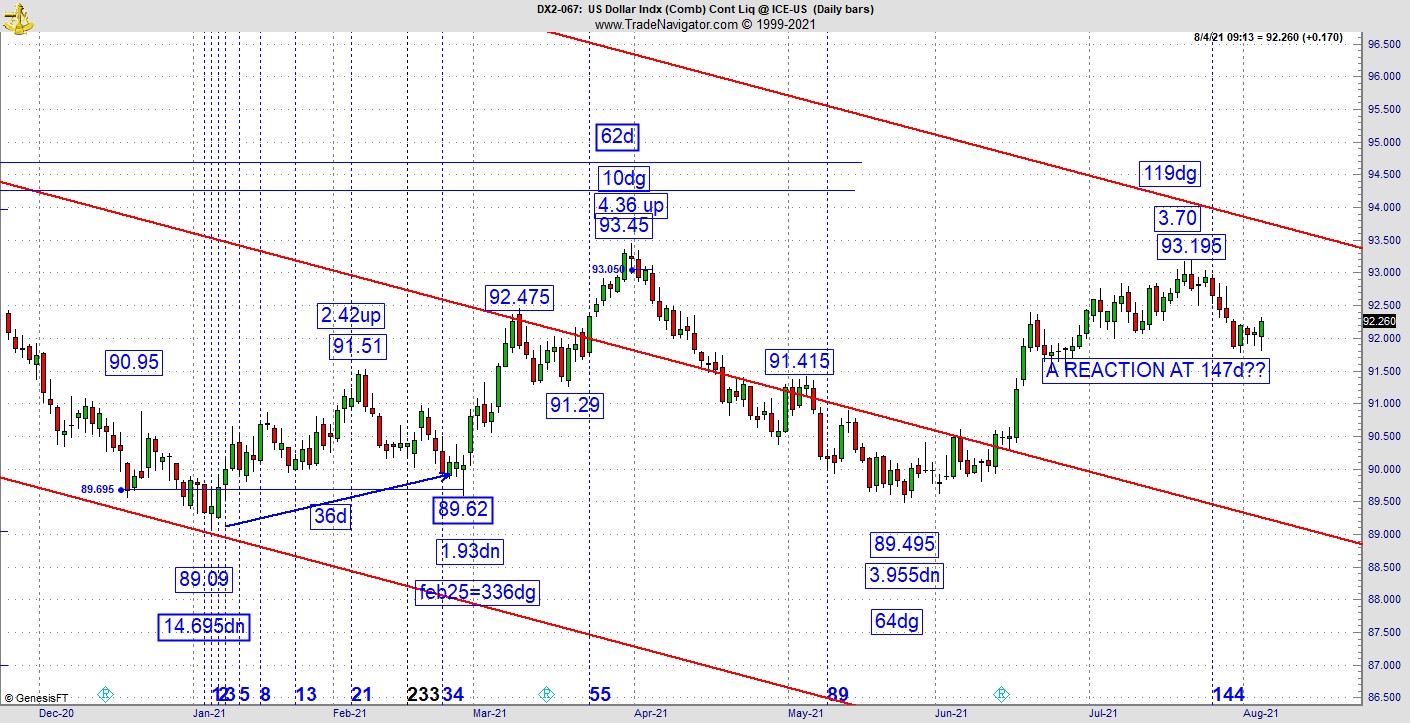
I might have been the first to see the reaction, but the big institutions have to see it as well for it to kick into gear. Wednesday is the first time it looked like it is going to happen. While I don’t trade the greenback, I encounter decisions like this every day on the charts I do trade. The Gann calendar works exactly the same way the intraday clock does with certain adjustments. Sometimes one does have a substantial edge against the people on the other side of the trade. What that means is there always seems to be a period in the trade where I have to dig down and find more patience until the wave develops. If I’m wrong, I’ll get stopped out. If I’m right what ends up happening, I have staying power to not get shaken out because I was late. I’m always talking about taking trades in the psychologically uncomfortable places on the chart. Compare and contrast the dollar pattern against the oil pattern. Oil had a good reading but had to overcome tremendous overhead resistance to sustain. That being said it still had a major reaction. On the greenback chart, it could easily get to the final test of the upper descending channel. It has a very good chance to push up to 93.50.
My sense of things from spending all day on the intraday charts is that recent really good long setups, even on a 15-minute chart are not working as good as they did even two weeks ago. Bulls have a little less traction and intraday shorts are starting to work a little better than they did before. Does that mean the market is starting to roll over? Personally, if I were a position trader, I don’t see a single reason to commit intermediate or long-term funds to the stock market on the long side.
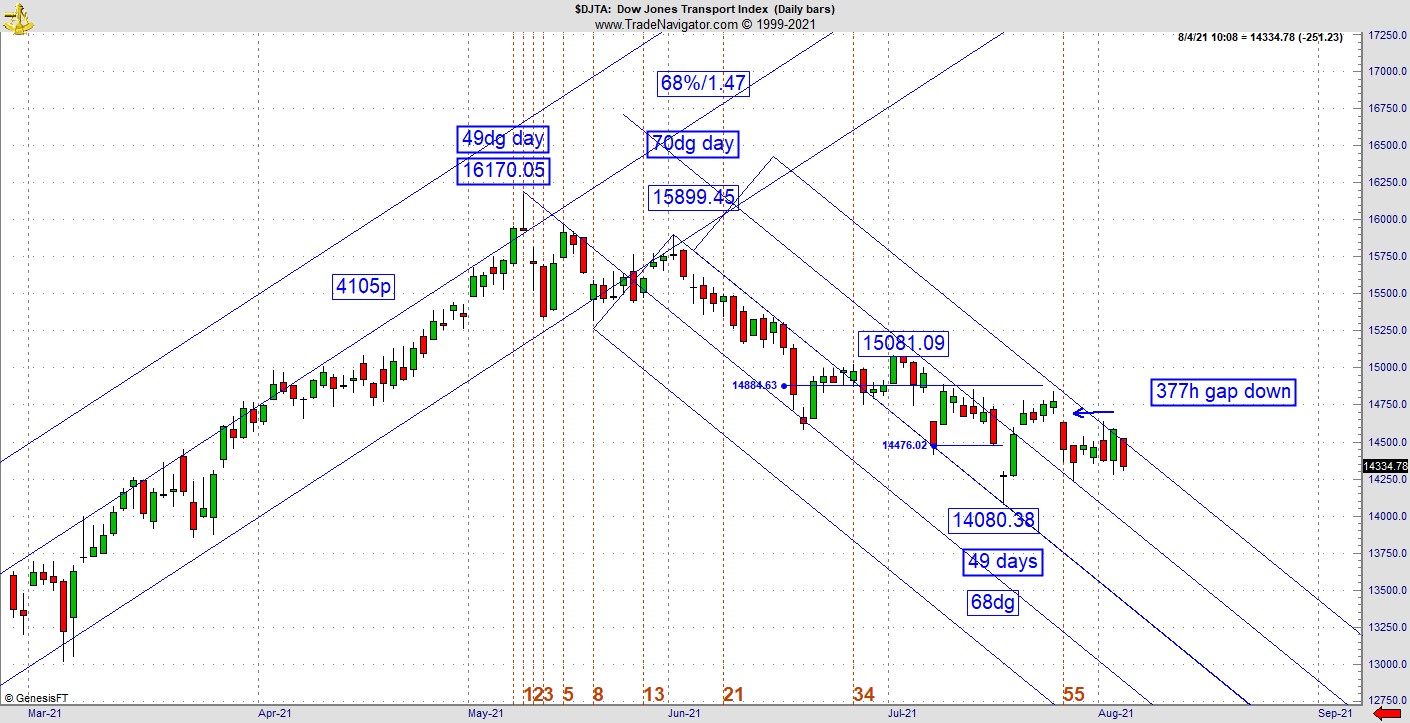
Finally, take a quick look at the Transports. Another week has passed, and they defended the 377-hour gap down. At the edge of the descending channel line, it is one good distribution day away from a serious drop. It is just another one of these charts that has good support vibrations and if taken out proves something much bigger has been developing.
For more information about Jeff Greenblatt, visit Lucaswaveinternational.com.


