

Some traders call August the traditional paint-drying season. Why is that, asks Jeff Greenblatt of Lucas Wave International?
Some years the action and volume rivals that of the Christmas holiday season. If you don’t live in Arizona or Florida, it's last call for the beach before the kids go back to school.
Its my contention this year will be different. Instead of watching sleeping markets, its vitally important to watch out for what is not happening just as much as we follow what is happening. Case in point is the Transports, which was on the precipice of disaster for weeks. One scenario, which did not materialize was a sustained move up on the oil chart. That “inflation tax” on the consumer could’ve wrecked the market right there. But it did not. Instead, we have lower oil and a recovering Transports.
![]()
That’s potentially good economic news that Transports are not moving lower in sympathy. At various points in this young century, the oil chart has acted as a good leading indicator for the economy. For the Transports, the top was the 49dg day on the Gann calendar. The low hit at 49 trading days down. The big challenge was the gap down at 377 hours off the top. Right now, Transports has broken out of a bearish sloping channel and filled the 377-hour gap. There’s still a lot of overhead resistance and the pattern is not out of the woods yet.
That being said, Transports did not tank when it had the potential to do so. Neither has the US dollar, which finally appears poised to test its own major bearish channel line just overhead. The greenback responded very nicely to its major square out point at 147 days off the bottom. I passionately believe in trading exactly what is in front of you, but I can’t ignore the larger 161-month window from the 2008 bottom. I think the market will have to start playing its hand for that exceptionally large cycle when it seriously challenges the channel line. It could happen very soon.
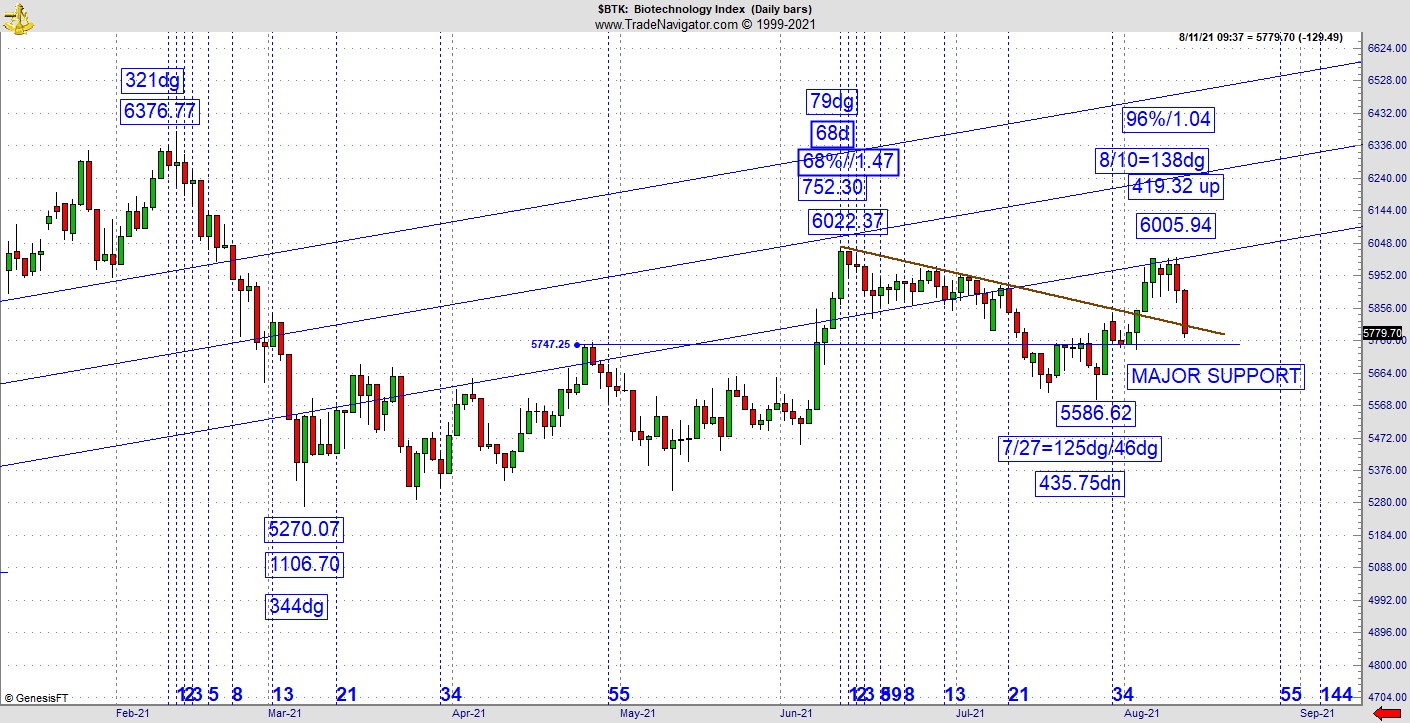
If you believe anything is only as good as it’s weakest link, we must look at the BTK and SOX. For the BTK, it is currently in a test of major support. First is the retest of polarity from July. The prior leg peaked in April before it hit the June high. The next test of the high failed to gain a new relative high and in just two days gave up most of the last thrust. As you can see not only is it a test of polarity but also of the magnet line where many times resistance develops into support on a sloping basis.
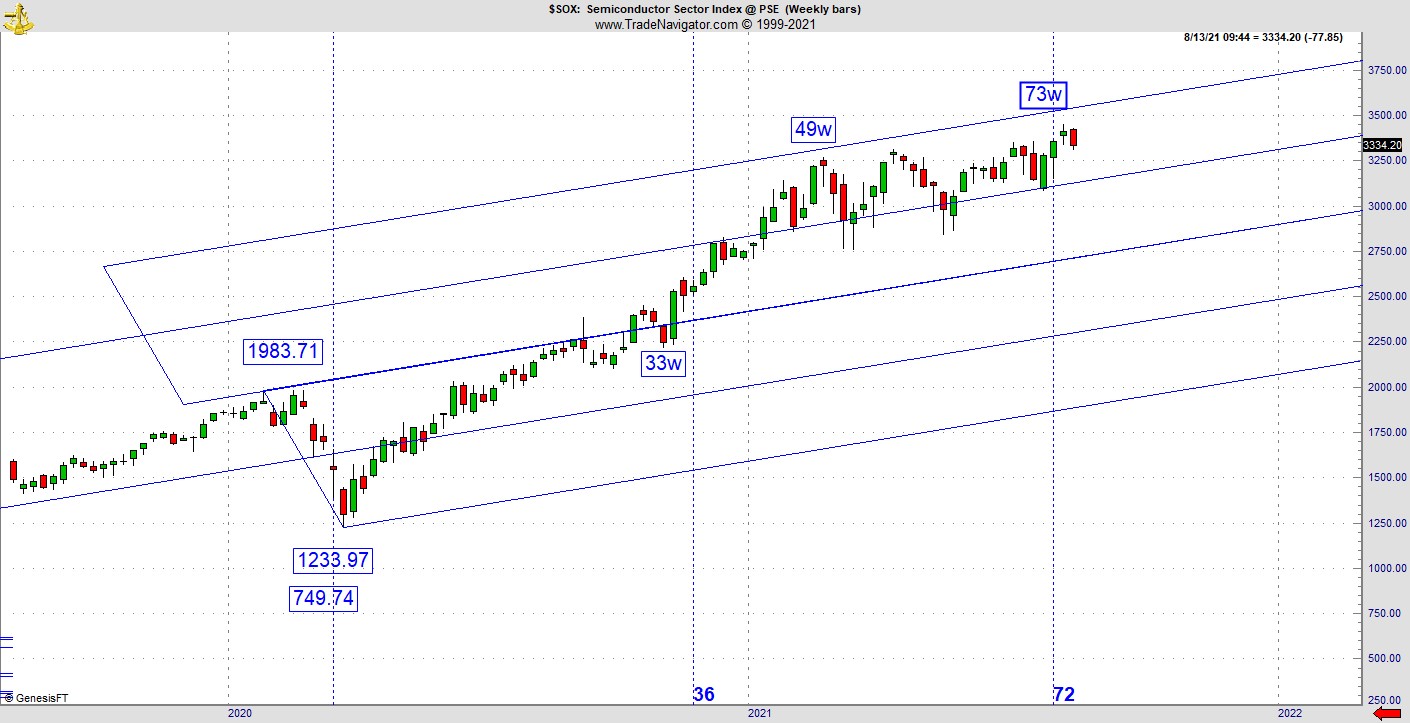
Okay, I knew the BTK was questionable. But the SOX? Let’s take a look. This is not yet very troublesome, but it could turn out that way. It is getting hit this week. The weekly chart shows a rally leg at 73 weeks off a range down at the 2020 low at 749.74. Key vibration here is the numbers to the right of the decimal point, which most traders pay no attention. In nonlinear, chaos theory, the pivot is also what is called a strange attractor. A strange attractor acts like a magnet, first attracting, then repelling. The numbers to the right of the decimal, which most consider the cents holder is really a time holder. If you really want predictive value in markets, look to major highs and low because the market is always telling on itself. In this case we’ve already had a couple of key hits. The low was 1233.97 and we had an important pullback low at 33 weeks. With a range of 749.74, another pullback it at 49 weeks. So here we are again with the potential for another hiccup.
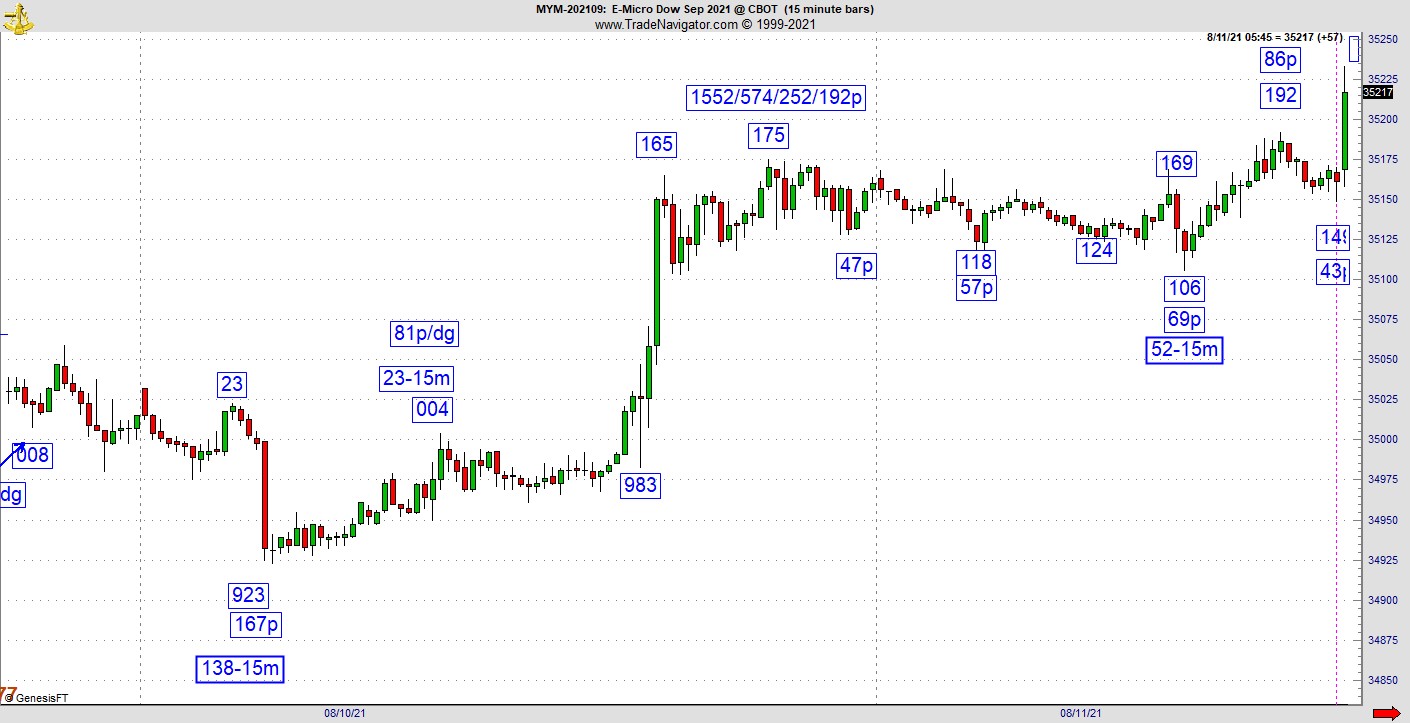
Since we are talking about predictive value in price and time square vibrations, let me show you the play of the day, which was the setup to Wednesday morning’s rally. The first thing to be done when a pattern hits a new high is to catalog the range back to the bottom or a series of key lows. In the Dow futures it turned out to be 1552/574/252 and 192 points respectively. The last major thrust was 252 points. What ended up happening is the pullback since Tuesday’s high turned out to be 52-15m bars. If you don’t get anything else, realize the range can and will manifest itself in terms of time elapsing on the next thrust. If this is your first exposure to this strategy, don’t take my word for it. Check it out for yourself. You’ll be pleasantly surprised at what you find.
The big takeaway from this update is it appears that when the market fixes one leak another springs elsewhere. Those of us watching a Dow theory divergence with the Transports now have to look at the other side of the fence where key sectors in technology are suddenly becoming questionable. Markets don’t usually fall apart in August but when they do fall apart, many times the origin of the trouble materialized in August.
For more information about Jeff Greenblatt, visit Lucaswaveinternational.com.


