

Getting into trading can be confusing for many people. It can be especially perplexing for non-teach and non-finance people. There are many ways of simplifying trading today, and that's exactly what we are going to do, states Marina "The Trader Chick".
Let’s discuss the basics of day trading!
Trading is super flexible. You can learn at your own pace and trade at your own pace.
There are four main types of trading: Day trading, scalping, position trading (buy and hold), and swing trading.
What is day-trading?
Day trading is one of the most popular trading methodologies and the one most people are interested in. To put it simply, day trading means buying and selling a financial asset (stocks, for example,) within a single trading day. You can day trade almost anything you want, from stocks to currencies pairs, and futures to Crypto.
But what does it really mean to "day trade"? It means that the stock (or whatever you choose to trade) you're buying will only be held for a few hours and sold at the end of the trading day.
"Buy and sell before the day ends, got it! Easy, right?" Not really, day trading is considered "risky" due to the short time period we're selling and buying. The good part of this is that there are many ways to mitigate this risk, and one of them is learning!
Basics of day trading
We can safely say that day trading is composed of some basic stuff you'll need to learn to start your trading journey; and in my opinion, they are charts, candlesticks, and indicators!
Candlesticks
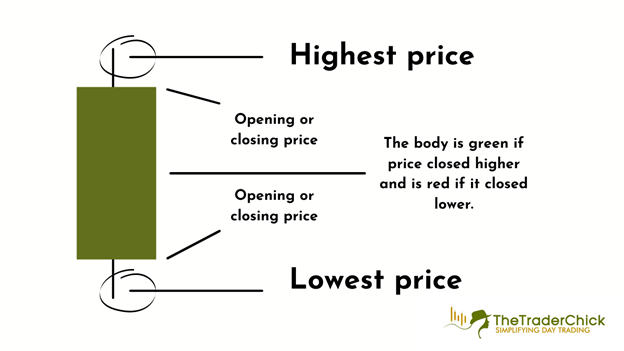
The easiest way to put this is that candlesticks are a way to represent the price of an asset in a certain period of time. A candlestick is composed of the upper wick (or shadow), the body (usually red and green), and the downer wick (or shadow).
But what does this mean? For example, a daily candlestick represents the price of a stock for that day, this means a candlestick will be created every single day.
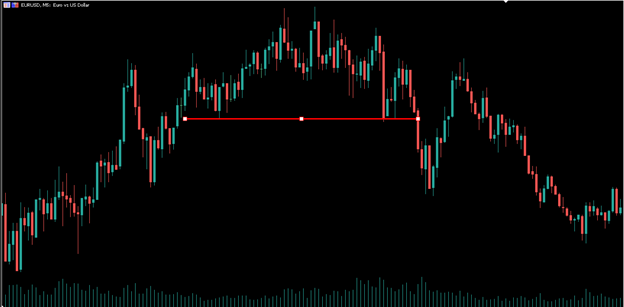
Charts
This is where the action happens, literally! A trading chart is where you find the information you need to trade. This is where the price action of an asset is drawn (yeah! Candlesticks are here). Also, you can find indicators here too. A chart is where you'll be doing your technical analysis and deciding when to enter or exit a position.
Indicators
The market is based on price, right? And the price is driven by buying or selling pressure, and this is what makes the patterns you see in a chart. So, indicators are statistics used to measure the condition of a market. Most indicators are made of historical price, volume, and open interest of an asset. There are four major types of indicators:
- Trend indicators: Are used to measure the direction and strength of a trend. For example, moving averages.
- Momentum indicators: Are used to identify the speed of price movement based on price over time. For example, stochastic oscillators.
- Volatility indicators: Regardless of the direction, they are used to measure the rate of a price movement. For example, Bollinger bands.
- Volume indicators: Volume indicators show the amount of traffic in a price movement, and are usually used to confirm a trading direction. For example, the volume rate of change.
To learn more about Marina Villatoro, please visit TheTraderChick.com.


