

The blue downward trend lines on the S&P 500 (SPX) chart tell us that this is still a bear market, says Lawrence McMillan of Option Strategist.
The halting rally that has taken place since mid-June has been pretty much a disappointment so far.
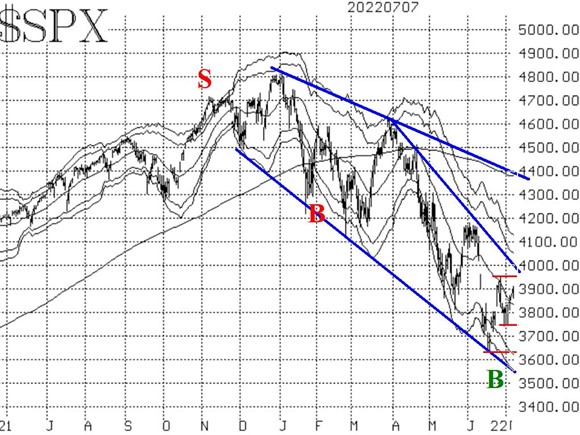
There is support at 3740 (last week's lows) and then at 3630 (the year-to-date lows). As for resistance, the previous short-term rally failed at 3945, so that qualifies as resistance.
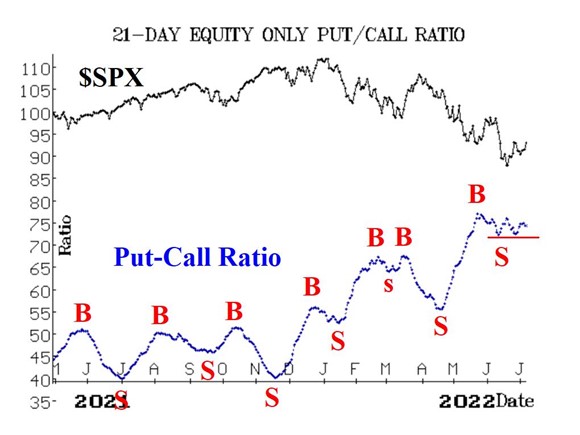
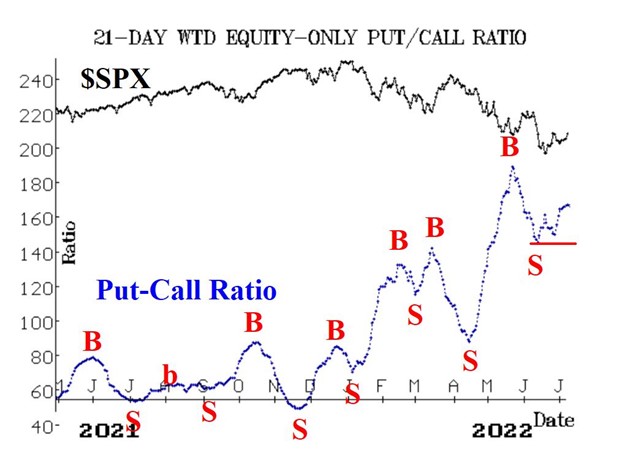
Equity-only put-call ratios remain on sell signals. By my definition, they will continue to do so until they fall below their early June lows.
So, for the time being, we will not consider them to be truly bullish until they break down below the horizontal red lines on the charts in Figures two and three.
Market breadth has improved and both breadth oscillators are once again on buy signals, as of July 5th. NYSE breadth has been much stronger than "stocks only" breadth.
However, New 52-week Highs continue to be extremely rare (only 11 yesterday, July seventh). They have languished at levels of 14 or lower on a daily basis for 19 trading days. New 52-week Lows, meanwhile, number in the hundreds, so this indicator remains on a sell signal.
The COBE Volatility Index (VIX) has been treading water more or less, moving in a sideways fashion for the past couple of weeks. As a result, the VIX "spike peak" buy signals of mid-June are still in effect.
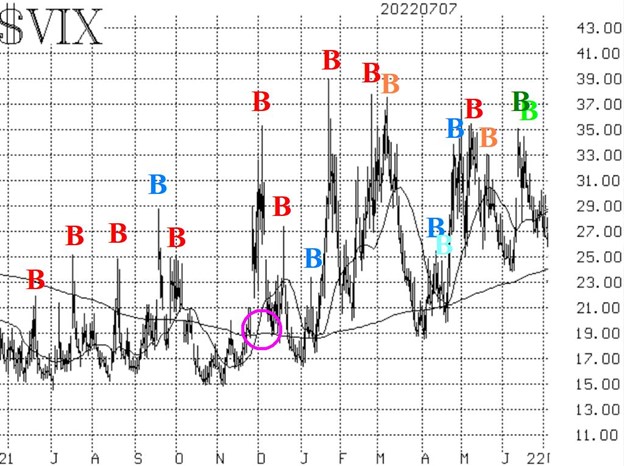
On an intermediate-term basis, though, the trend of VIX remains upward, which is bearish for stocks. That trend is determined by the fact that both VIX and its 20-day Moving Average are above the 200-day Moving Average.
In summary, we continue to maintain a "core" bearish position, in line with the trends of SPX (down) and VIX (up). We will also continue to trade short-term signals around that "core" bearish position.


