

Over the summer, I once again highlighted the uniquely insightful work of my friend, Michael Oliver, states Jesse Felder of TheFelderReport.com.
Michael studies momentum within the markets and how it typically behaves through various cycles. When we got together almost two years ago to record a podcast there was one particular momentum chart he was focused most intently on. That was the monthly chart of the Nasdaq 100 Index about which he wrote, “It’s rare to get such a massive and clear momentum structure developed, in this case, the red horizontal [line at 40%] on the bottom chart. It traces back to 2012. A violation of that in-your-face structure (which will not be evident on price) would open the door wide for a drop to the next key level around zero line/36-mo. avg.” Below is his latest version of the chart.
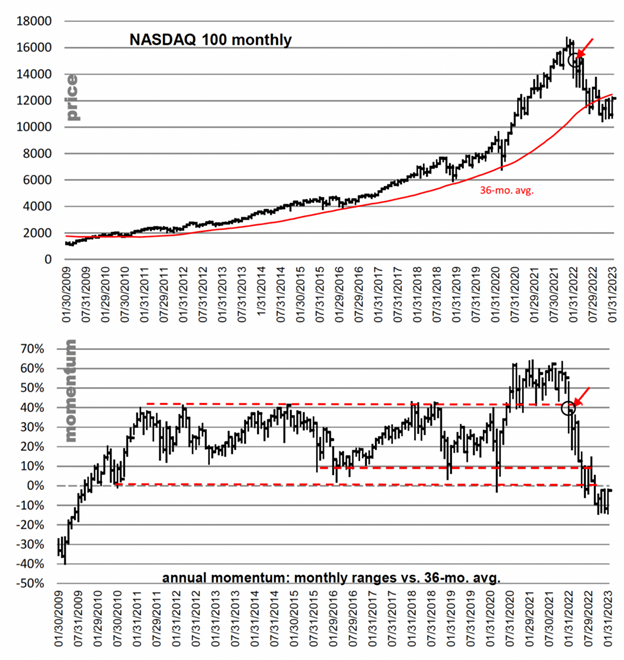
In January 2022, that first horizontal line was broken to the downside, signaling an important change in the character of the market. Over the duration of the year, prices came to reflect that change as it became evident to all that a bear market had begun. Furthermore, momentum not only dropped down to the zero line, as Michael had anticipated, but it also broke down decisively below that “key level” in September. In Michael’s own words, “The first major sell signal is marked by circles and arrows. It was followed by layer after layer of further breakage. Now action is hanging at a very shallow oscillator level below the low readings of the prior dozen years. Not oversold, not aged. Just hanging in there with hope.”
Notably, the strongest January for the index since 2001 only took the momentum back up to test that broken support level from below. Bulls better “hope” the current rally continues, taking momentum back into the bull market range that existed from 2010 to 2022, and soon. Otherwise, this most recent breakdown could prove another critical signal of an even more significant change in the character of the stock market.
Learn more about Jesse Felder at TheFelderReport.com.


