

What’s it going to take to revive THIS chart?
That was my first thought yesterday when I looked at the chart of existing home sales. The National Association of Realtors reported that “used” home sales slid 0.5% to a seasonally adjusted annual rate of 4 million last month. That marked the worst April for that part of the housing market since 2009 – 16 years ago!
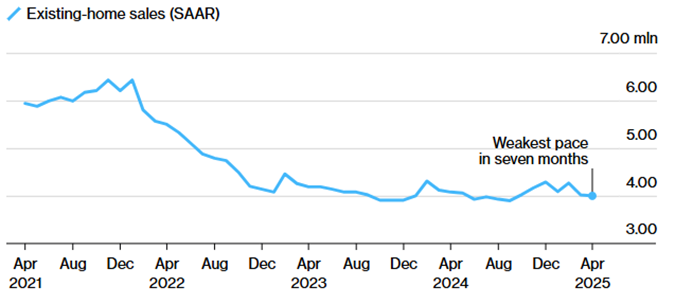
Source: National Association of Realtors via Bloomberg
Plus, as you can see in the MoneyShow Chart of the Day, this isn’t a fluke reading. Sales have been stuck in this beaten-down range for more than two years now.
That’s starting to weigh on home prices, as I wrote about Wednesday. Annual home price appreciation slowed to just over 4% in April, the smallest rise since July 2023, according to Redfin.
Separate data from S&P CoreLogic Case-Shiller shows that so-called “Sun Belt” markets are among those showing the worst performance. Prices are falling year-over-year in Tampa, stagnant in Dallas, and rising only slowly in Miami, Phoenix, and Atlanta.
Until interest rates drop (rather than RISE, as they’ve been doing lately!), we’re unlikely to see much progress for housing stocks. The SPDR S&P Homebuilders ETF (XHB) was recently down 9.6% year-to-date, while the iShares US Home Construction ETF (ITB) was off 13.5%.
But if you’re the contrarian type, keep an eye on those charts, too. If you see some bottoming action in XHB and ITB, you might be able to play them for a bounce.


