

Over many years in the market, as a trader and an investor, I've learned the hard way that you can't cheat the system. It doesn't work that way. But I have made one discovery. And it begins with what we know to be true about the behavior of asset prices: Asset prices trend, explains JC Parets, founder of TrendLabs.
If the price of a stock is trending higher, there is a much higher likelihood the price of that stock will continue higher versus reverse and head lower. This is the truth. This is why technical analysis works. And if we know asset prices trend...and if we know we only get paid if we sell at higher prices than we buy...we should probably spend time looking for those trends.
So, that's what we do. Whenever we're looking for trends, the rule of thumb is to always go one timeframe higher than where you normally trade or invest. In other words, if you tactically use daily charts going back six to nine months, take it one degree higher. Look for trends on the weekly charts going back several years to get structural perspective.
If you're a day-trader or swing-trader who uses 10-minute charts for tactical decisions in the market, look at daily charts for the longer-term time horizon. This is the multiple timeframe approach.
Regardless of time horizon, my cheat code for trend identification is to analyze the monthly charts. No one does this. And they're all wrong. This is THE hack in the market.
We only get monthly candlesticks 12 times per year. That's it. With only 12 data points each year, this process of reviewing monthly charts forces us to recognize the direction or primary trends. We don't want to fight these trends. That's a great way to lose money in the market.
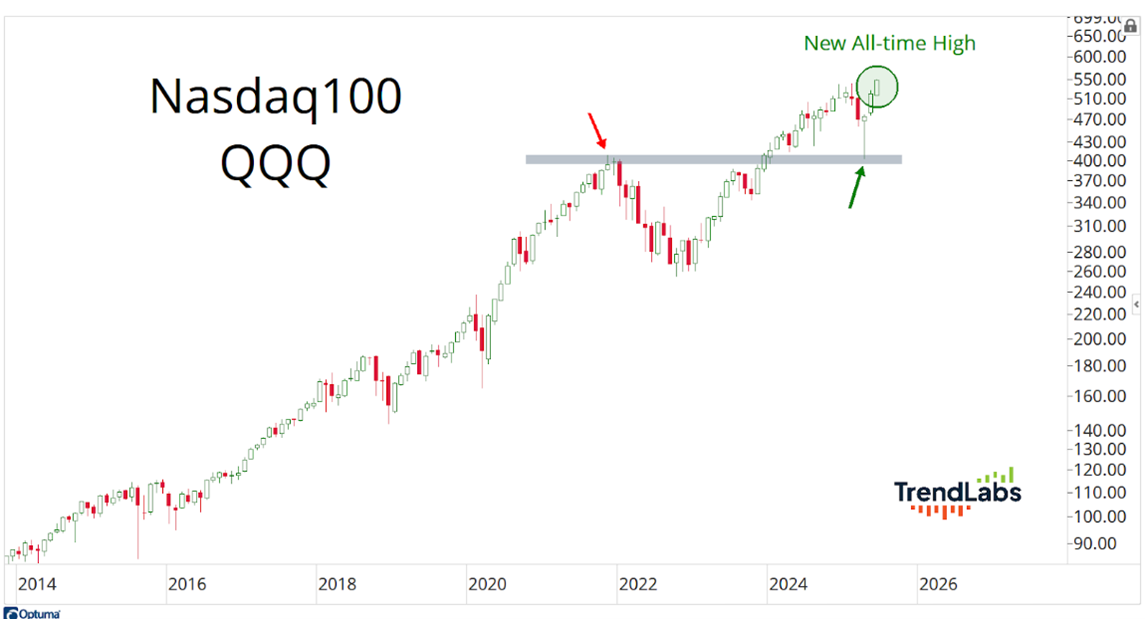
So, which monthly charts do we want to review at the beginning of every month? All of them. That includes the major US indexes – the Invesco QQQ Trust (QQQ), the S&P 500 Index (^SPX), the Dow Jones Industrial Average, even the small-caps and mid-caps.
In fact, I have a list of about 150 to 200 monthly charts I review at the beginning of every month, with fresh monthly closing data. It's the most valuable part of my entire process.


