

What about housing?
It’s a question I used to get a LOT. After all, I closely analyzed and wrote about the mortgage and real estate industries for years. But even though I haven’t heard it much from friends, family members, colleagues, readers, and conference attendees, I have heard a few people talk about housing STOCKS and ETFs as value/turnaround plays.
Which brings me to today’s pair of MoneyShow Charts of the Day. First up is the year-over-year change in the (yes it’s a mouthful!) S&P CoreLogic Case-Shiller US Home Price Index. You can see that after booming during Covid and the year or two afterward, house price appreciation collapsed. Then prices started falling.
Chart 1: The Case-Shiller Home Price Index (YOY % Change)
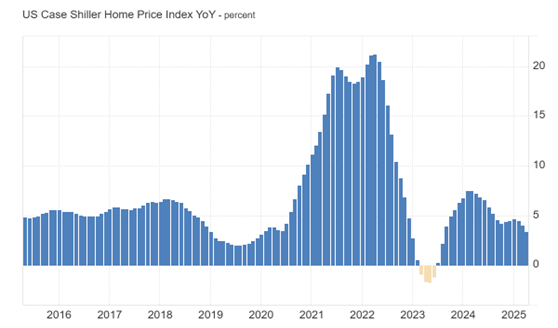
Source: S&P CoreLogic, via Tradingeconomics.com
Price growth resumed in late 2003, accelerated into 2024, but has been easing back ever since. That brings me to my next chart, which shows the SPDR S&P Homebuilders ETF (XHB).
The $1.5 billion ETF owns shares of 35 home builders, building products companies, home improvement retailers, and home furnishings firms. Sample names include PulteGroup Inc. (PHM), TopBuild Corp. (BLD), Lennox International Inc. (LII), and Toll Brothers Inc. (TOL). I used a weekly timeframe and am showing a half-decade of trading.
Chart 2: The S&P Homebuilders ETF (XHB)
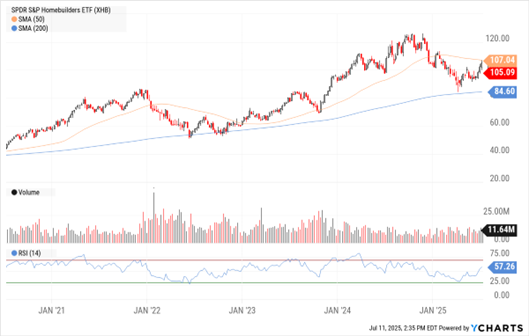
Data by YCharts
You can see that the XHB fared poorly in late-2023, rallied throughout 2024, then slid lower into April – just like the broad averages. But even as the lagging house price data hasn’t turned up, XHB held support at the 200-week simple moving average, then started rallying. It’s now challenging overhead resistance at the 50-week SMA. RSI is confirming the rebound.
I wouldn’t say housing stocks are out of the proverbial woods. But I’d watch this level, see if they can punch through that resistance, and if so? Maybe take a stab at XHB or related stocks as potential value plays.


