

It’s the heart of summer…so it’s only appropriate to see the “Beach Ball” pattern showing up in the stock market!
Take a look at the MoneyShow Chart of the Day, which shows the SPDR S&P 500 ETF (SPY) from mid-July onward. The white vertical bars are the regular trading sessions, while the light blue bars represent after-hours and pre-market trading.
What stands out to me? You can’t keep this market down – just like a beach ball when you try to shove it underwater!
SPDR S&P 500 ETF (SPY)
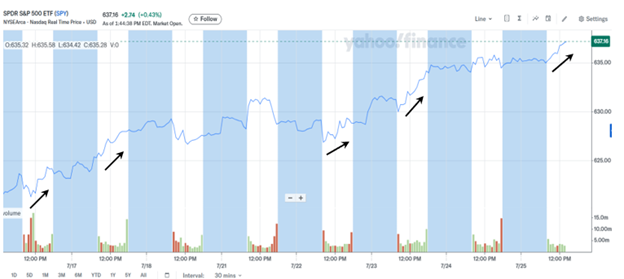
Source: Yahoo Finance
Weak opens are getting bought. Intraday dips are getting bought. We’re closing strong on many days. And even when we don’t, the intraday damage is contained. Strong opens aren’t giving way to atrocious closes.
Yes, we’re heading into a seasonally weak period of the year. August and September can be more turbulent and less rewarding than other months.
August 2024 featured wild volatility thanks to sharp movements in the Japanese yen, for instance. And I’ll never forget August-September 1998, when stocks tanked after Russia defaulted on its debt and Long-Term Capital Management blew up.
But if the beach ball market manages to stay buoyant through the next several weeks, we could be in for a great finish to the year. Now…where’s my sunscreen?


