

The SPDR S&P 500 ETF (SPY) remains in an intermediate uptrend from October 2022. After hitting a low this April, SPY consolidated its gains, broke out of its channel, then followed by making new all-time highs. Still, the Money Flow Index has turned down and appears to have peaked, writes Bonnie Gortler, CEO of BonnieGortler.com.
Figure 1: Fear & Greed Index
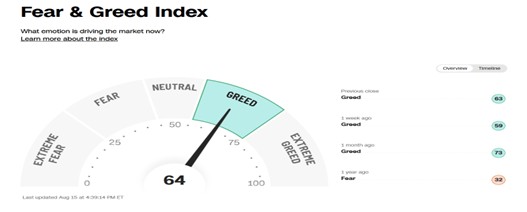
Source. CNN.com
Investor sentiment, as measured by the Fear and Greed Index (a contrarian indicator), rose over the past two weeks to 64, indicating a shift to Greed from neutral. If it rises to Extreme Greed, implying too much optimism, it would be negative in the short run.
Figure 2: NYSE New Lows
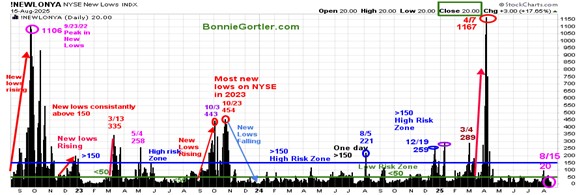
Source: Stockcharts.com
New lows on the NYSE peaked at 1,167 on April 7, then contracted sharply as the market bottomed. New lows closed at 20 last week, falling into the very low-risk zone where prices tend to rise. It is positive in the short term if new lows stay between 25 and 50. On the other hand, if new lows increase above 150, it would be short-term negative.
Figure 3: SPY Weekly (Top), 12-26-9 MACD (Middle), and Money Flow (Bottom)
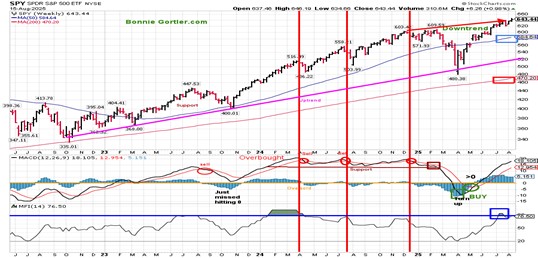
Source: Stockcharts.com
The MACD (middle chart) remains on a buy, above 0. MACD can generate a sell signal if there is weakness. A weekly close below 634.66 in SPY would imply a pullback toward 620 – and potentially more.
Bottom line: The bulls have been in control. SPY has hit its daily price objective at the upper channel. But weakening momentum and declining money flow continue to be worrisome. The intermediate trend is extended, the risk of a pullback is on the rise, and it could occur at any time.


