

It’s time for a damage assessment in markets. A battlefield analysis of major asset classes to see which ones the war is hurting the most – and what that might say about the future.
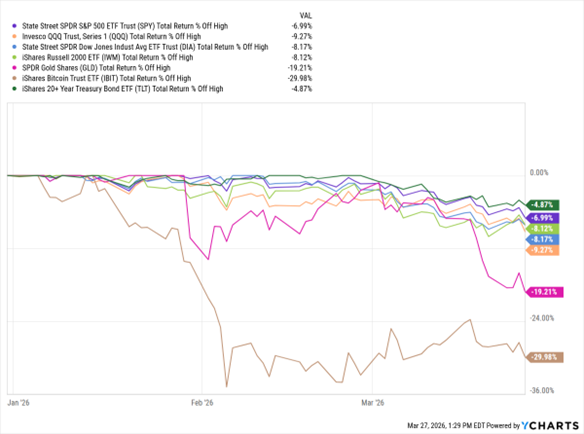
This week’s MoneyShow Chart of the Day shows how far various tracking funds have fallen from their 2026 highs. Bonds are down but not out – with the iShares 20+ Year Treasury Bond ETF (TLT) off 4.8% through late last week.
But cryptocurrencies are spiraling, with the iShares Bitcoin Trust ETF (IBIT) plunging 29.9%. Gold isn’t doing much better than Bitcoin, flirting with the standard bear market definition of down 20%.
Damage Assessment: Bonds Not so Bad, Bitcoin and Bullion Blasted
Data by YCharts
In equities, we haven’t hit the 10% “correction” threshold. But we’re not far from it. The Invesco QQQ Trust (QQQ) was off 9.2% recently, with the State Street SPDR S&P 500 ETF Trust (SPY) only modestly stronger at minus-6.9%. Small caps and industrials are roughly in-between at minus-8.1%.
What’s the message here? Nothing is TRULY safe in this conflict-driven market except for oil and energy stocks – and even there, the volatility is off the charts.
So-called “safe haven” assets like Treasuries are losing ground, even if they’re outperforming stocks. Gold isn’t getting the job done for reasons I shared last week. And crypto is continuing a bleeding process that began all the way back in October – though some MoneyShow experts believe Bitcoin is basing here.
Bottom line? If you want real safety, you have to stay in cash. And if you’re an active trader, you want to keep position sizes smaller and avoid shooting for the fences – until the conflict ebbs.


