

You’ve heard of a Rorschach test, right? The one where you’re shown a series of inkblot images – and your answers are used as a psychological analysis tool? Well today, it’s time for your TECH sector test!
Here’s my MoneyShow Chart of the Day — a nine-month chart of the Invesco QQQ Trust (QQQ). Do you think it’s bullish? Or bearish?
Invesco QQQ Trust (QQQ)
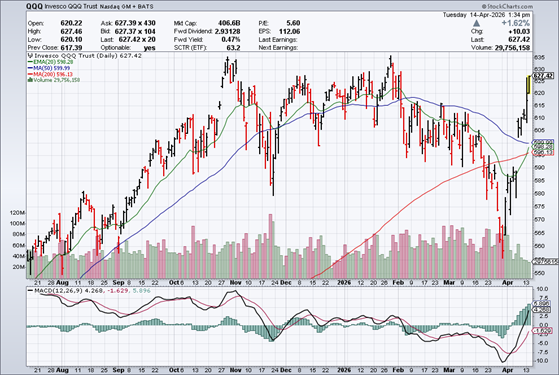
Source: StockCharts
If you’re a bull, you’ll probably point to the recent 10-day winning streak and the fact the QQQs are back to roughly breakeven on the year. If you’re a bear, you’ll probably highlight how the QQQs have gone nowhere since November, and that we’ve been rallying on steadily falling volume.
I didn’t show the charts here. But bulls could also point to the fact the iShares Russell 2000 ETF (IWM) is near its old highs...while bears could say the Invesco S&P 500 Equal Weight ETF (RSP) and SPDR Dow Jones Industrial Average ETF (DIA) remain well below their pre-war peaks.
So, what do you see? Something to get excited about? Or a market that still hasn’t proved itself?
Make sure you can answer that question to your OWN satisfaction before committing more capital here. From where I sit though, it looks like the jury is still out.


