

Earnings season remains hot, with plenty of beats and a few misses. Some of the largest market-cap and high relative-strength names are reporting this week. But it might be time to start thinking about hedging some of the recent monstrous gains in the S&P 500 Index (^SPX), writes John Eade, president of Argus Research.
We do not talk about cycle analysis because we find it to be hit or miss. We also don't talk about Elliott Wave counts because there are many different interpretations to each bullish and bearish wave, making it well beyond practical comprehension. So, we will throw the following out there and see if it sticks to anything.
S&P 500 Index (^SPX)
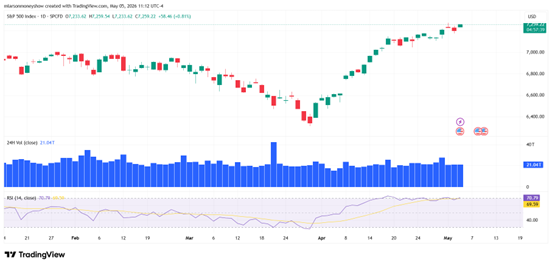
Source: TradingView
There is an 18-week cycle for the SPX, which could also be called a 36-week cycle. From top to bottom and from bottom to top, the cycle is 18 weeks. From cycle low to the next cycle low, it is 36 weeks. The current 18-week advancing cycle will peak in the next week or two.
The last cycle peak and cycle bottom did not work. But the cycle bottoms in April 2025, August 2024, November 2023, and March 2023 were pretty accurate – and the cycle tops in December 2024, April 2024, and July 2023 worked very well.
Looking at a one-hour chart, the current advance since March 30 appears to be wave five (or the last leg). Based on the size of the first wave higher -- and if the fifth wave equals the first wave -- we come to a target of 7,350 for the SPX.
So, if the cycle works and our wave count is close, it is time to start thinking about hedging some gains. There is strong chart support in the 6,800-7,000 region, though, so any decline might not be too painful.


