

Even though it has been more than a week since the S&P 500 Index (^SPX) finished April with an impressive 10.4% gain, there is still an ongoing discussion about the abrupt reversal and what to expect in the near term. Here’s my take, explains Jeff Hirsch, editor-in-chief of The Stock Trader’s Almanac.
Take the gains and “sell in May” or will this strength continue? First let’s put some context around this year’s April S&P 500 gain. It was the fourth best April for the S&P 500 since 1930.
The closest comparable April in recent years was in 2020 when the S&P 500 jumped 12.7%. Prior to that, the last time the S&P 500 climbed double digits in April was way back in 1938 (+14.1%). The best April ever: +42.2% in 1933.
(Editor’s Note: Jeff will be speaking at the 2026 MoneyShow Masters Symposium Las Vegas, scheduled for July 19-22. Click HERE to register.)
For our research today, a “big” April is defined as a gain of at least three times April’s average (mean) monthly performance since 1950. This works out to be a 4.6% gain when April 2026 is included.
Since 1950, there have been 15 other years when the S&P 500 gained 4.6% or more. When compared to the other 61 years, big April gains were broadly bullish for May, the remainder of the year, and the full year, with average performance essentially double “All Other Years.”
Performance in May saw the biggest improvement, jumping to a 2.1% gain following Big Aprils versus a 0.07% decline in “All Other Years.” Frequency of gains (% higher) also improved across the board.
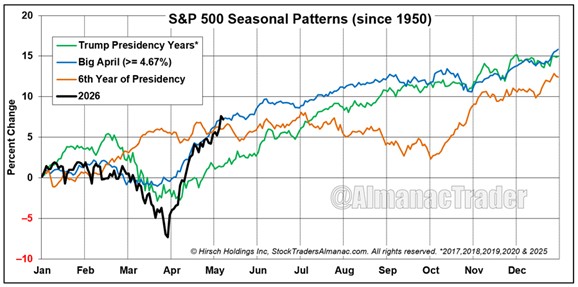
For those of us that enjoy a quick graphic, we plotted the 15 Big April years in the S&P 500 Seasonal Pattern chart. We have included the 6th Year of Presidency, Trump Presidency Years, and 2026 as of last week for comparison.
All three patterns end the year at approximately the same level, around 12%-15%, pushing the upper range of our base case 2026 forecast. Still, we cannot rule out the possibility of some volatility along the way due to the Iran conflict, high crude oil prices, tepid seasonal factors, and midterm elections.


