

Three different internal indicators have generated sell signals over the past week or so, but the most important indicator – the chart of S&P 500 Index (^SPX) – remains bullish. When these conditions exist, it is usually the chart of SPX that wins out, notes Lawrence McMillan, editor of Option Strategist.
SPX had a modest pullback this past week, but it didn't even fall as far as the rising 20-day moving average. SPX found support near 7,330 and, rather quietly, bounced off of that general level three times this month.
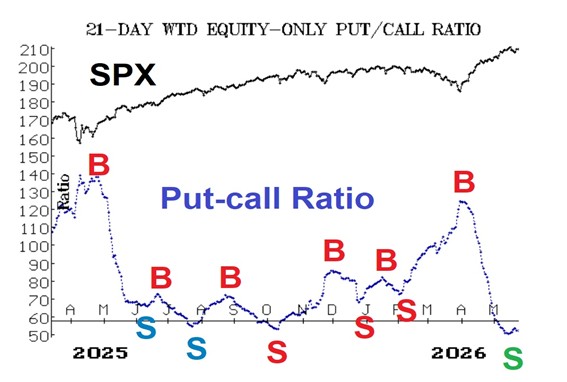
Still, equity-only put-call ratios curled upward this week, thus confirming new sell signals – both in terms of the computer analyses as well as the naked eye. These sell signals are coming from overbought conditions – especially in the case of the weighted ratio.
Breadth had deteriorated enough a week ago that sell signals were generated and confirmed for both breadth oscillators. That negativity in breadth continued through May 19, and by that time, the breadth oscillators were already in oversold territory.
This is our shortest-term indicator, so it can swing dramatically and quickly from one extreme to the other. Indeed, two strong days of positive breadth stopped out those breadth oscillator sell signals.
In summary, the main thing is that the SPX chart remains bullish. In addition, there are some sell signals in place, and we have acted on those – and we will closely watch their targets and stops. But continue to roll deeply in-the-money options.