

I can’t ignore it. After all, it’s the ONE table traders all over social media can’t stop talking about! And it raises a simple question: Is the stock market peaking?
Check out my MoneyShow Table of the Day, which comes from a report published by Bank of America US Equity & Quant Strategy. It was accompanied by straightforward advice from department head Savita Subramanian: “Too many red flags. Take profits.”
Is this a Peak? Count the Checkmarks!
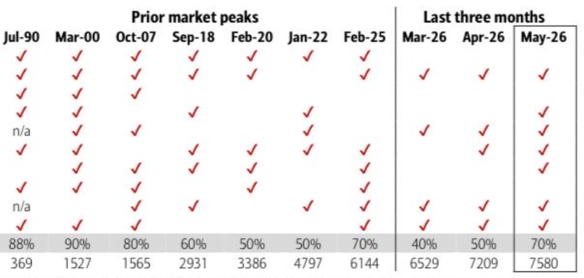
Source: Bank of America US Equity & Quant Strategy
The gist of it? That 70% of the firm’s “bear market signposts” have been triggered as of May. That’s in-line or greater than what we saw at other market peaks in 2018, 2020, 2022, and 2025. It’s also approaching the 80% level seen in October 2007, though not quite at the 90% “red alert” level seen in March 2000.
I cut off the full list of indicators because they’re wordy and wouldn’t render well onscreen. But suffice it to say that five are sentiment-based, two are valuation-derived, and three are macro-focused. Among the signals that fired are those tied to tightening of credit conditions, low-PE stocks underperforming high-PE names by a significant margin, and survey data measuring investor bullishness.
So, is this “it” for the bull market? I’m certainly not going that far. Plenty of other people have warned about the same thing in the last few years…and we know how well that panned out.
But there has been enough interesting activity (like the “Revenge of the Tortoises”) lately that you should pay it some attention. It's why I've been recommending you diversify – and that doesn’t mean just owning 10 different tech stocks! It means having exposure to other stocks and sectors in this evolving “Be Bold” market.


